Introduction
So this is the second of my ultra linear bias optimization studies. This one is for the 6L6 power pentode and, like the last one for the 6V6, is done for the 5kΩ plate load case. Since doing the 6V6 assessment almost three years ago, I decided that I needed a more robust way to perform the task. So I built out this simple jig.
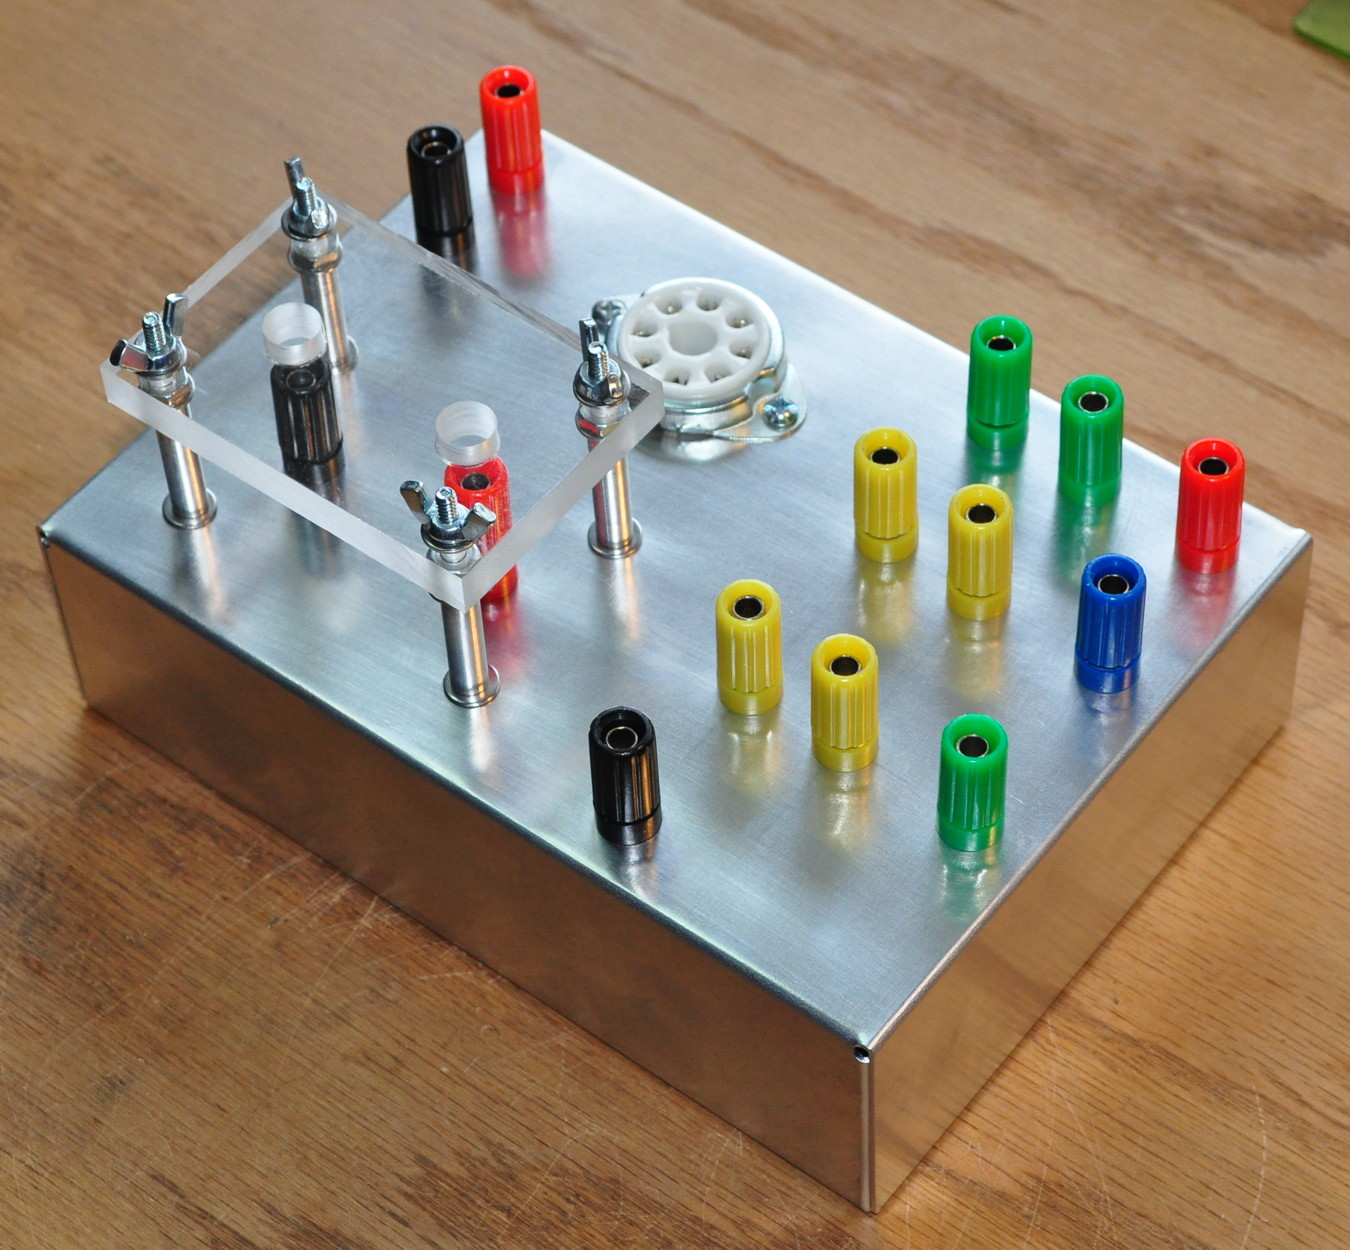
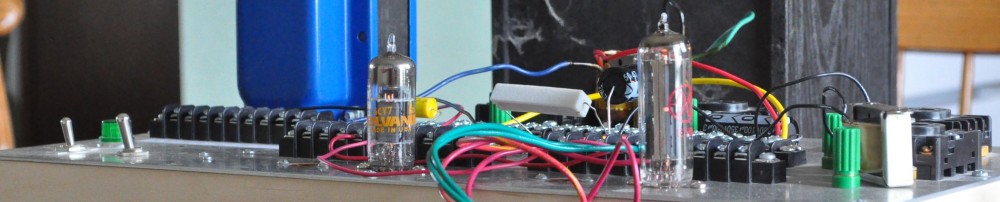
This jig is basically the same, electrically, with the setup I used for the 6V6 investigation. The real difference is that this makes the process simpler and safer. Here is the schematic showing what’s included in the jig.
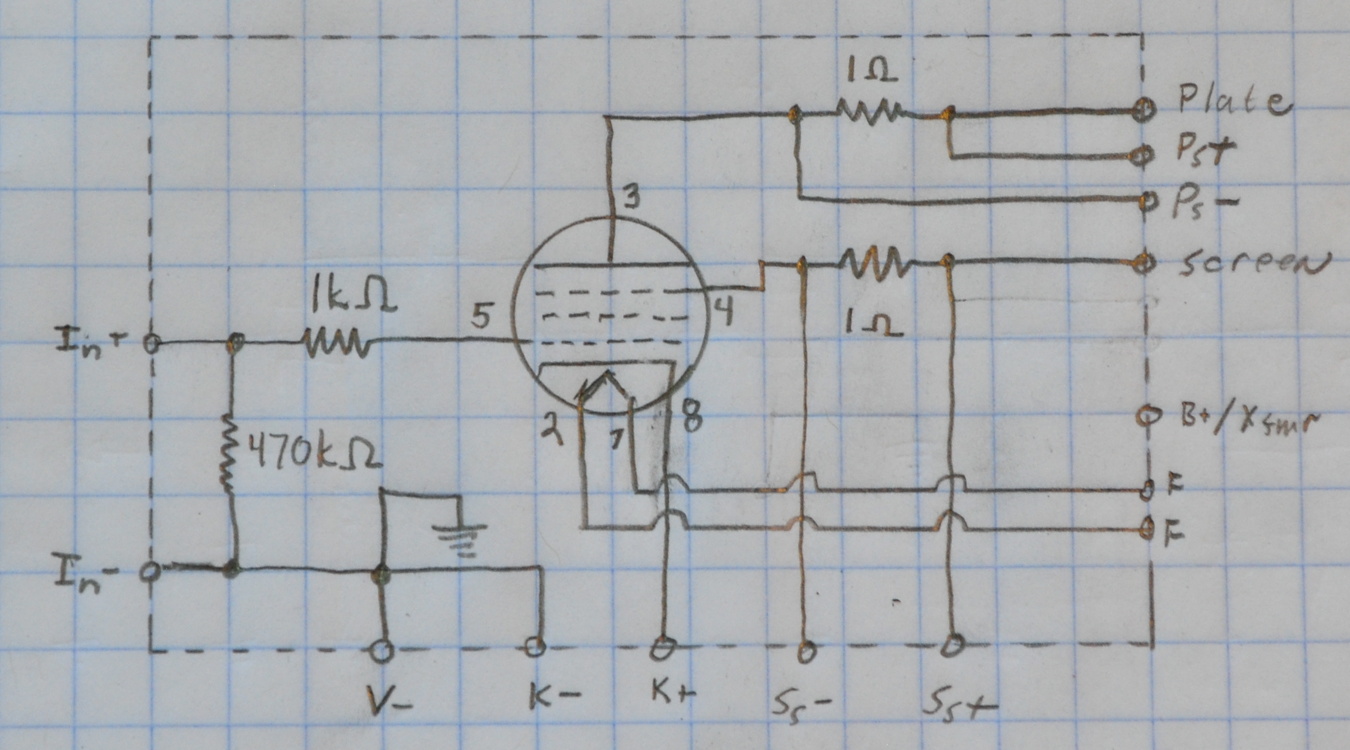
By including the sense resistors and grid input circuit in this jig, I can make the majority of connections with normal test leads. This makes the entire process a lot more robust and less prone to error.
The Setup
For the 6L6, as I indicated above, I decided on a 5kΩ plate load for the UL investigation. Some may question this choice as the commonly used plate load for the 6L6 in SE pentode configuration is between 2.5kΩ and 3.5kΩ. However, I did have a single UL plate characteristics plot from several years back. Working with data and trying out a few configurations led me to believe that the 5kΩ load would be a better fit for the 6L6 in SE-UL configuration.
As before, I wanted to control for constant plate voltages, choose several values based on data sheet information and vary the bias levels at these plate voltages to see how the tube performs. Looking at the various data sheets, I decided on the following five values of plate voltage (i.e. the DC voltage between plate and cathode pins): 250v, 275v, 300v, 325v, and 350v. At each plate voltage I varied the bias voltage and collected data on power out (in the 8Ω load), harmonic distortion, plate and screen dissipation, and current levels. All data was taken at 1kHz. For this study I used an Edcor GXSE 10-5K transformer. Edcor lists the max current on this transformer as 80mA. I definitely pushed this on some of the data points but I didn’t ever see any major signs of core saturation. All the same I would make sure that whatever transformer you choose is rated for the current required.
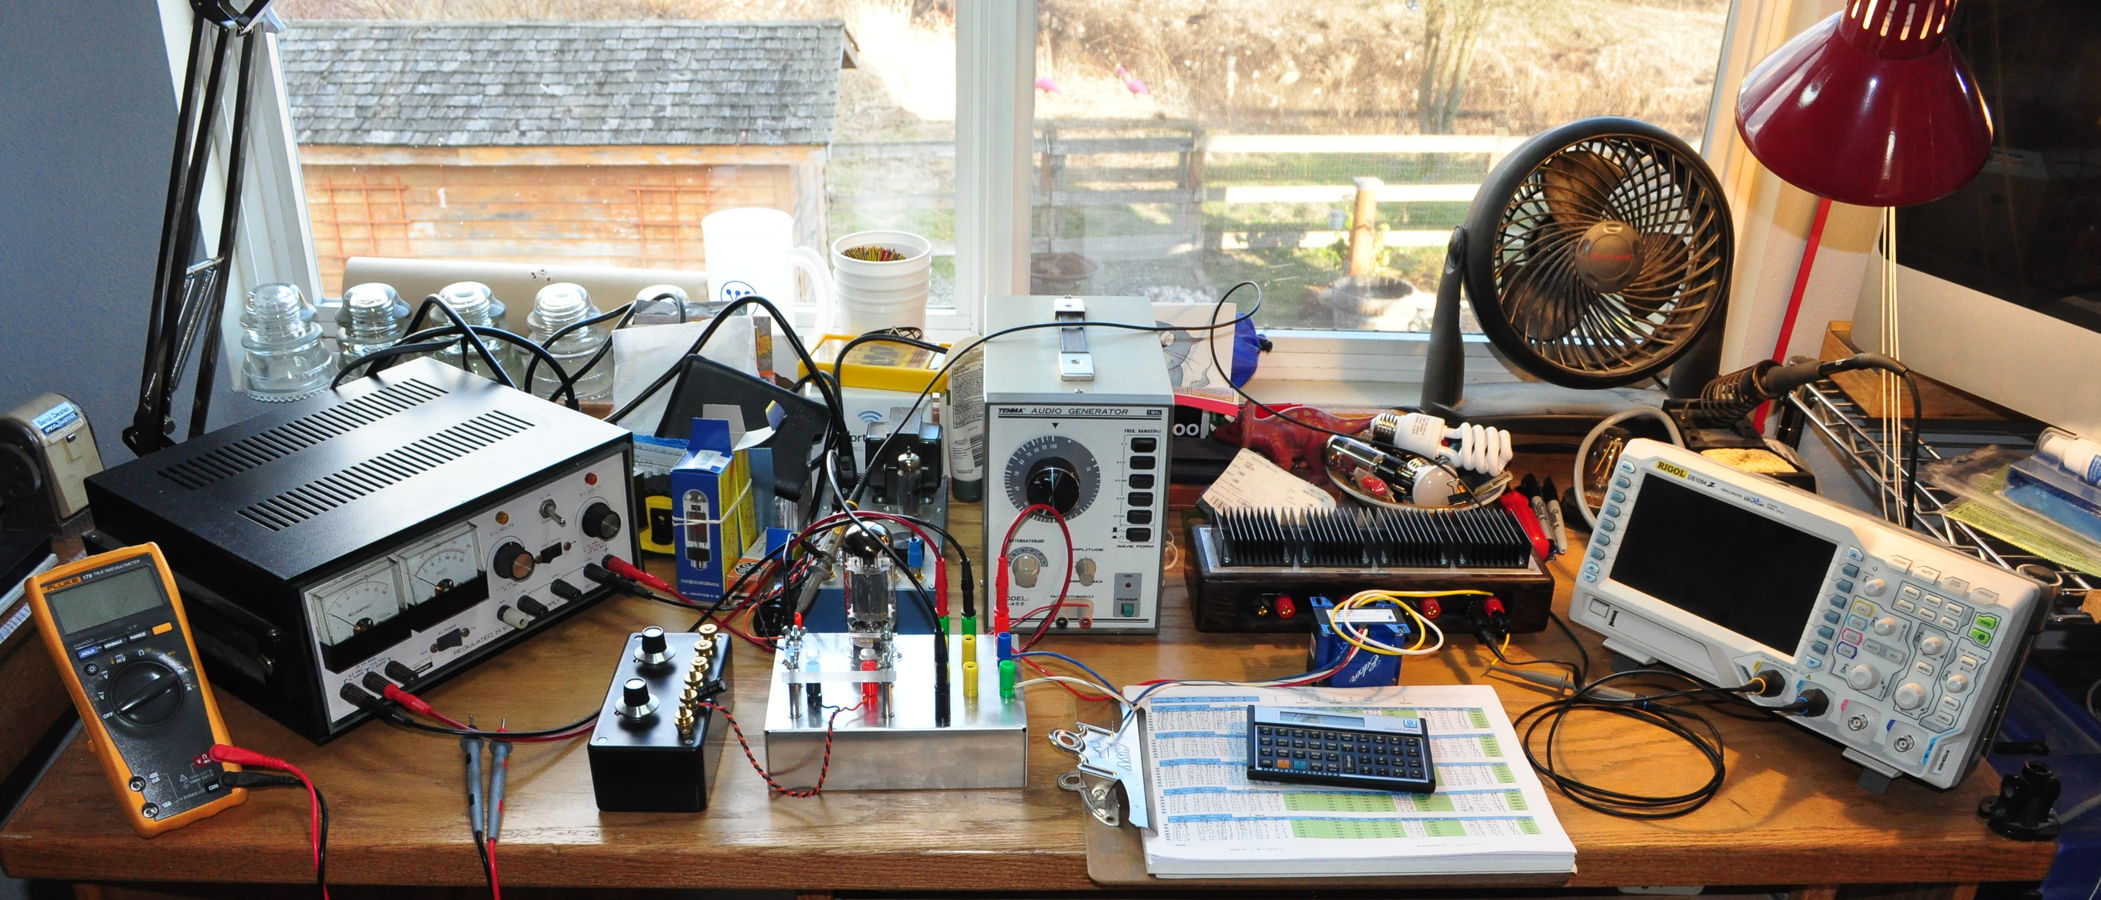
At this point I should make a comment about my test setup; specifically my power supply. My main power supply on my bench is a rebuilt HeathKit IP-17 HV power supply. This supply has two main limitations. First is that it only goes to 400vdc. This means that I couldn’t go to 375v Vp unless I wanted to use fixed bias. Since I had decided to stick with cathode bias, just like the 6V6 study, means that I had to limit myself to 350v Vp. The second limitation is that this supply only supplies a maximum of 100mA. This means that I had to limit the lower bias voltage conditions, due to available current. All the same, there was still sufficient capacity to check out a good range of operation on the 6L6.
Here is the test setup just after I finished taking all the data.
The Data
I took the data the same way as before. I set the B+ for a given plate voltage, adjusted for a bias voltage that resulted in a combined current which was close to the limit of the IP-17, and then walked up the bias voltage until the falloff in performance was getting pronounced. At no point did I run into any kind of excessive distortion. I should also mention that I also never saw any 4th or higher order harmonic distortion. This is a distinct and striking difference from the 6V6 tube data.
The first piece of data, and the one in which most people are probably most interested, is the RMS power output verses the bias voltage. This data is shown below.
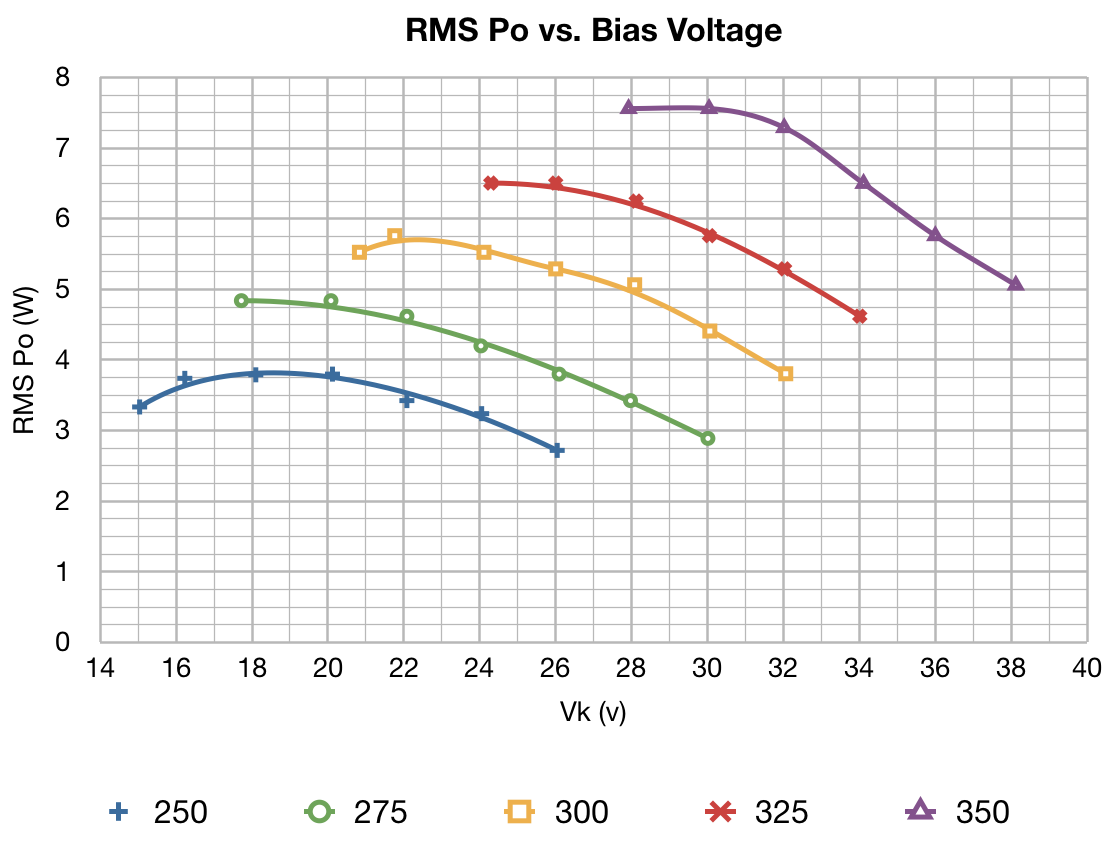
This data set shows how the maximum RMS output power delivered to the load (as measured at the actual load resistor) varies with bias voltage at each of the chosen plate voltages. Because plate current increases as the bias voltage is reduced, the maximum plate dissipations are represented by the left most points on each curve. As before, the plate voltage seems to be the major driver in maximum power output. Variation in bias voltage at a given plate voltage really doesn’t have a great effect on peak RMS power output. The maximum variation being less than 1.5dB except for the very highest bias voltage point on each of the 275v, 300v, and 350v curves. Also, as before, there appears to be a bias voltage “sweet spot” on each of the plate voltage curves with respect to the power out.
The next piece of data, which is of as much importance as the power curves above, is the distortion data. The following plot shows the total harmonic distortion in percent, verses bias voltage, at each of the chosen plate voltages.
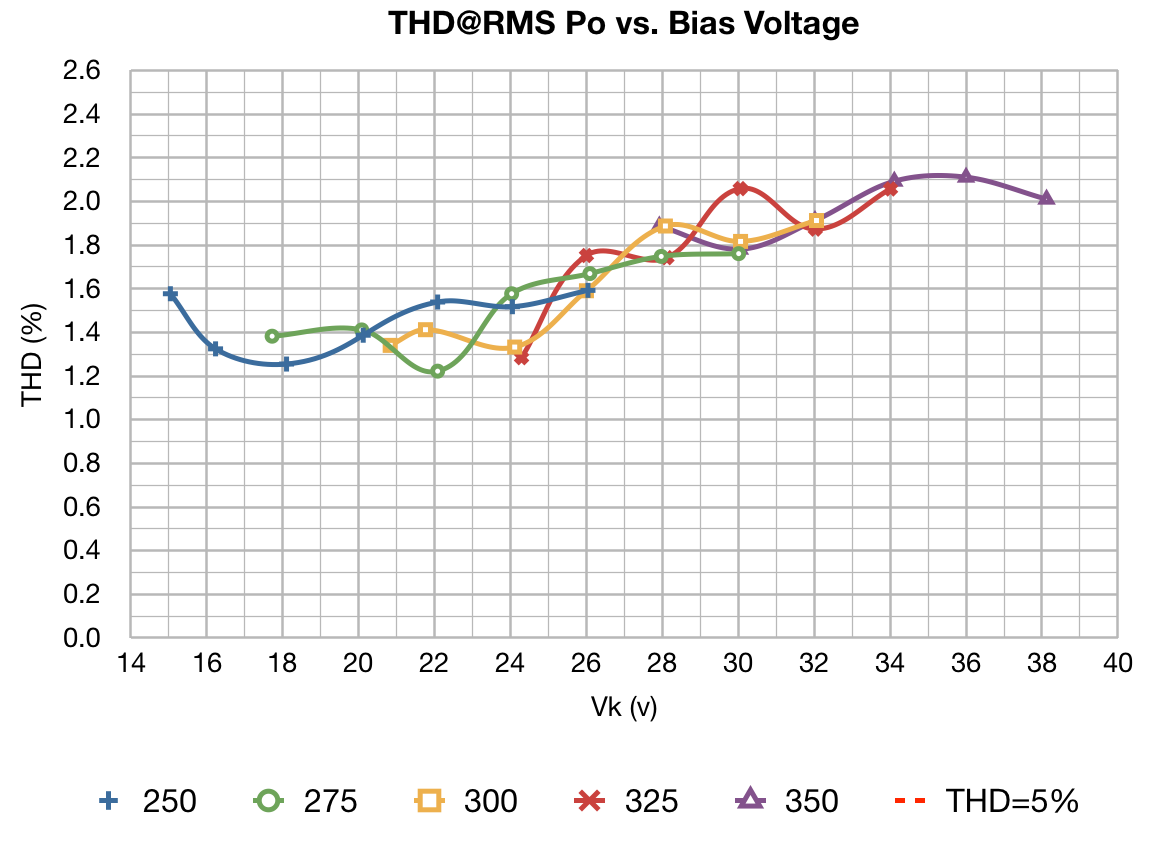
The first thing to notice here is that the distortion does not seem to vary by plate voltage. Unlike the 6V6 which showed distinct distortion variations by plate voltage, the 6L6 seems to not exhibit such a dependancy. However, in this plot you can see that the distortion does seem to show a slow increase with bias voltage. This got me to wondering about the overall signal chain distortion, so I decided to see if I could isolate the driver distortion and then estimate only the residual power stage distortion.
Now, for a driver in this setup, I just grabbed a 4S preamp with a JJ ECC83S (12AX7) preamp tube. This was never intended to be a driver circuit outputting large voltages, so I thought the distortion measurements should tell me something interesting. So here is the measured distortion of just the signal generator and the 4S driving the grid resistor in the test jig.
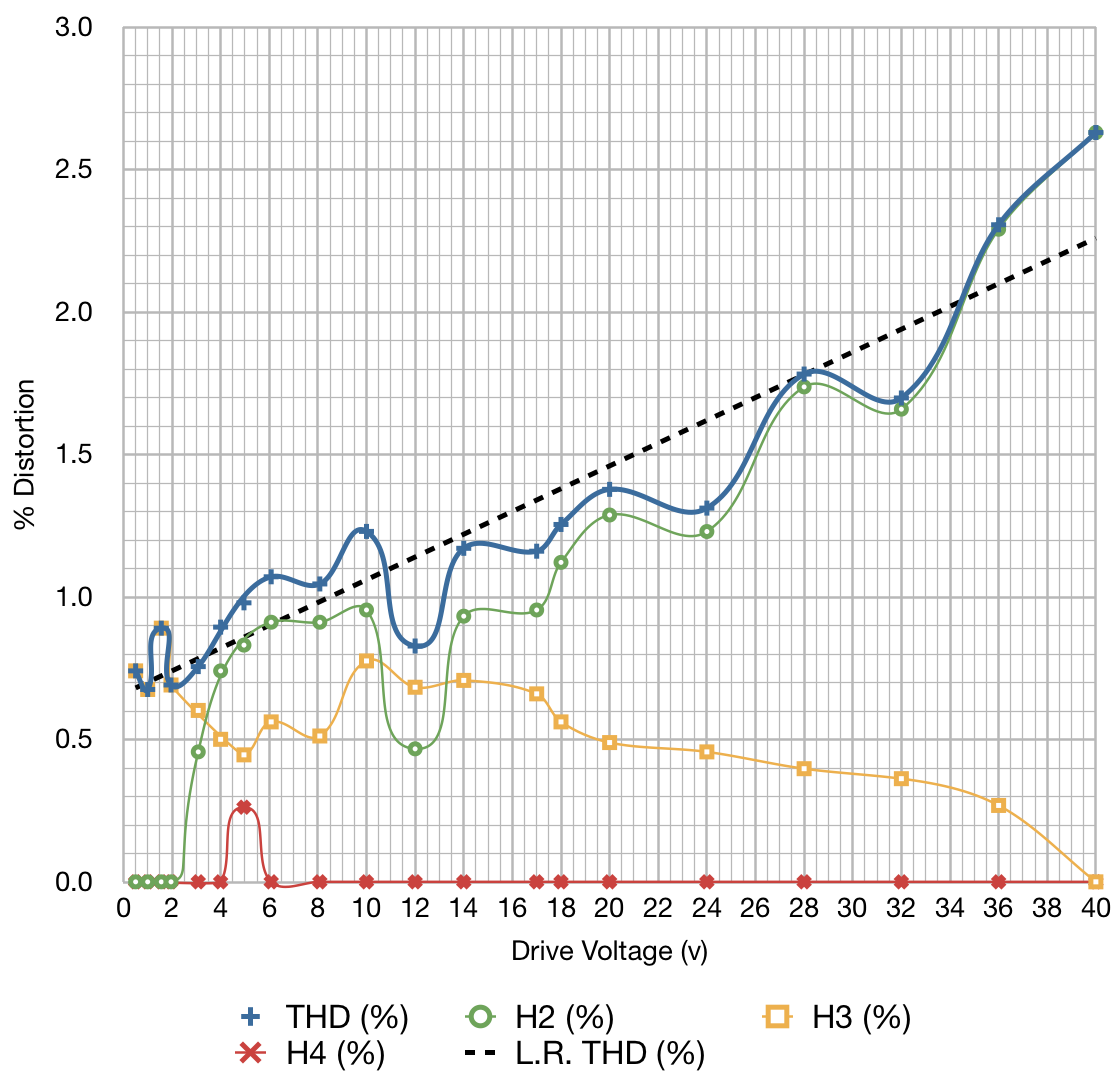
On this plot you can also see a linear regression fit to the driver distortion as a function of drive voltage. This could easily be the reason for the increasing distortion in the THD plot above. So I decided to back out the best fit curve of driver THD from the total measured THD to see what the residual distortion looks like. After removing the driver distortion, this is what was left for the residual power stage THD.
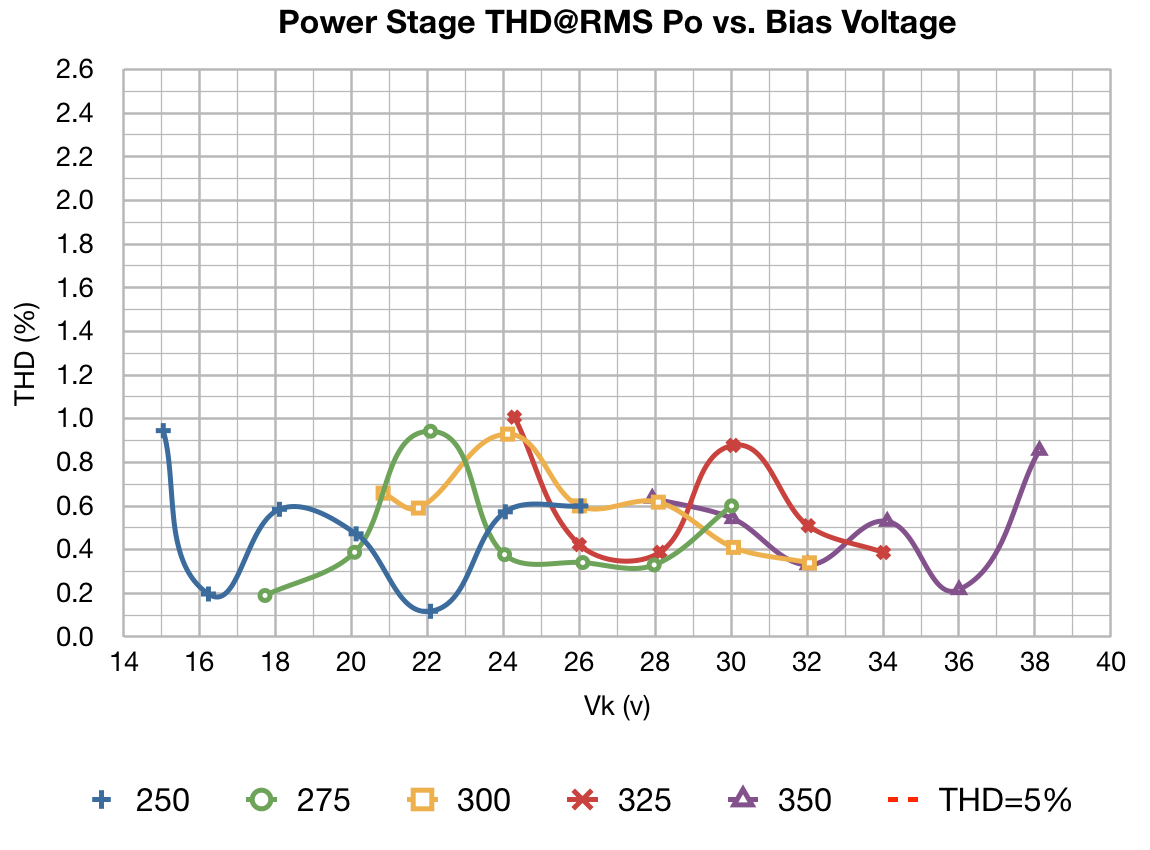
As can be seen in the plot, all the distortion numbers are below 1% at peak power out with an average of around 1/2%. So the takeaway message on distortion is that the choice of optimization points really doesn’t depend on distortion. Regardless of the points chosen, the design should produce a nice clean output. In light of this, the optimization points will instead be chosen based on other factors like output power, plate and screen power dissipations, and required current draws.
Since distortion is not going to be a driving factor in the optimization, the next items to be examined are the plate and screen power dissipations. Here are the plots from the raw data.
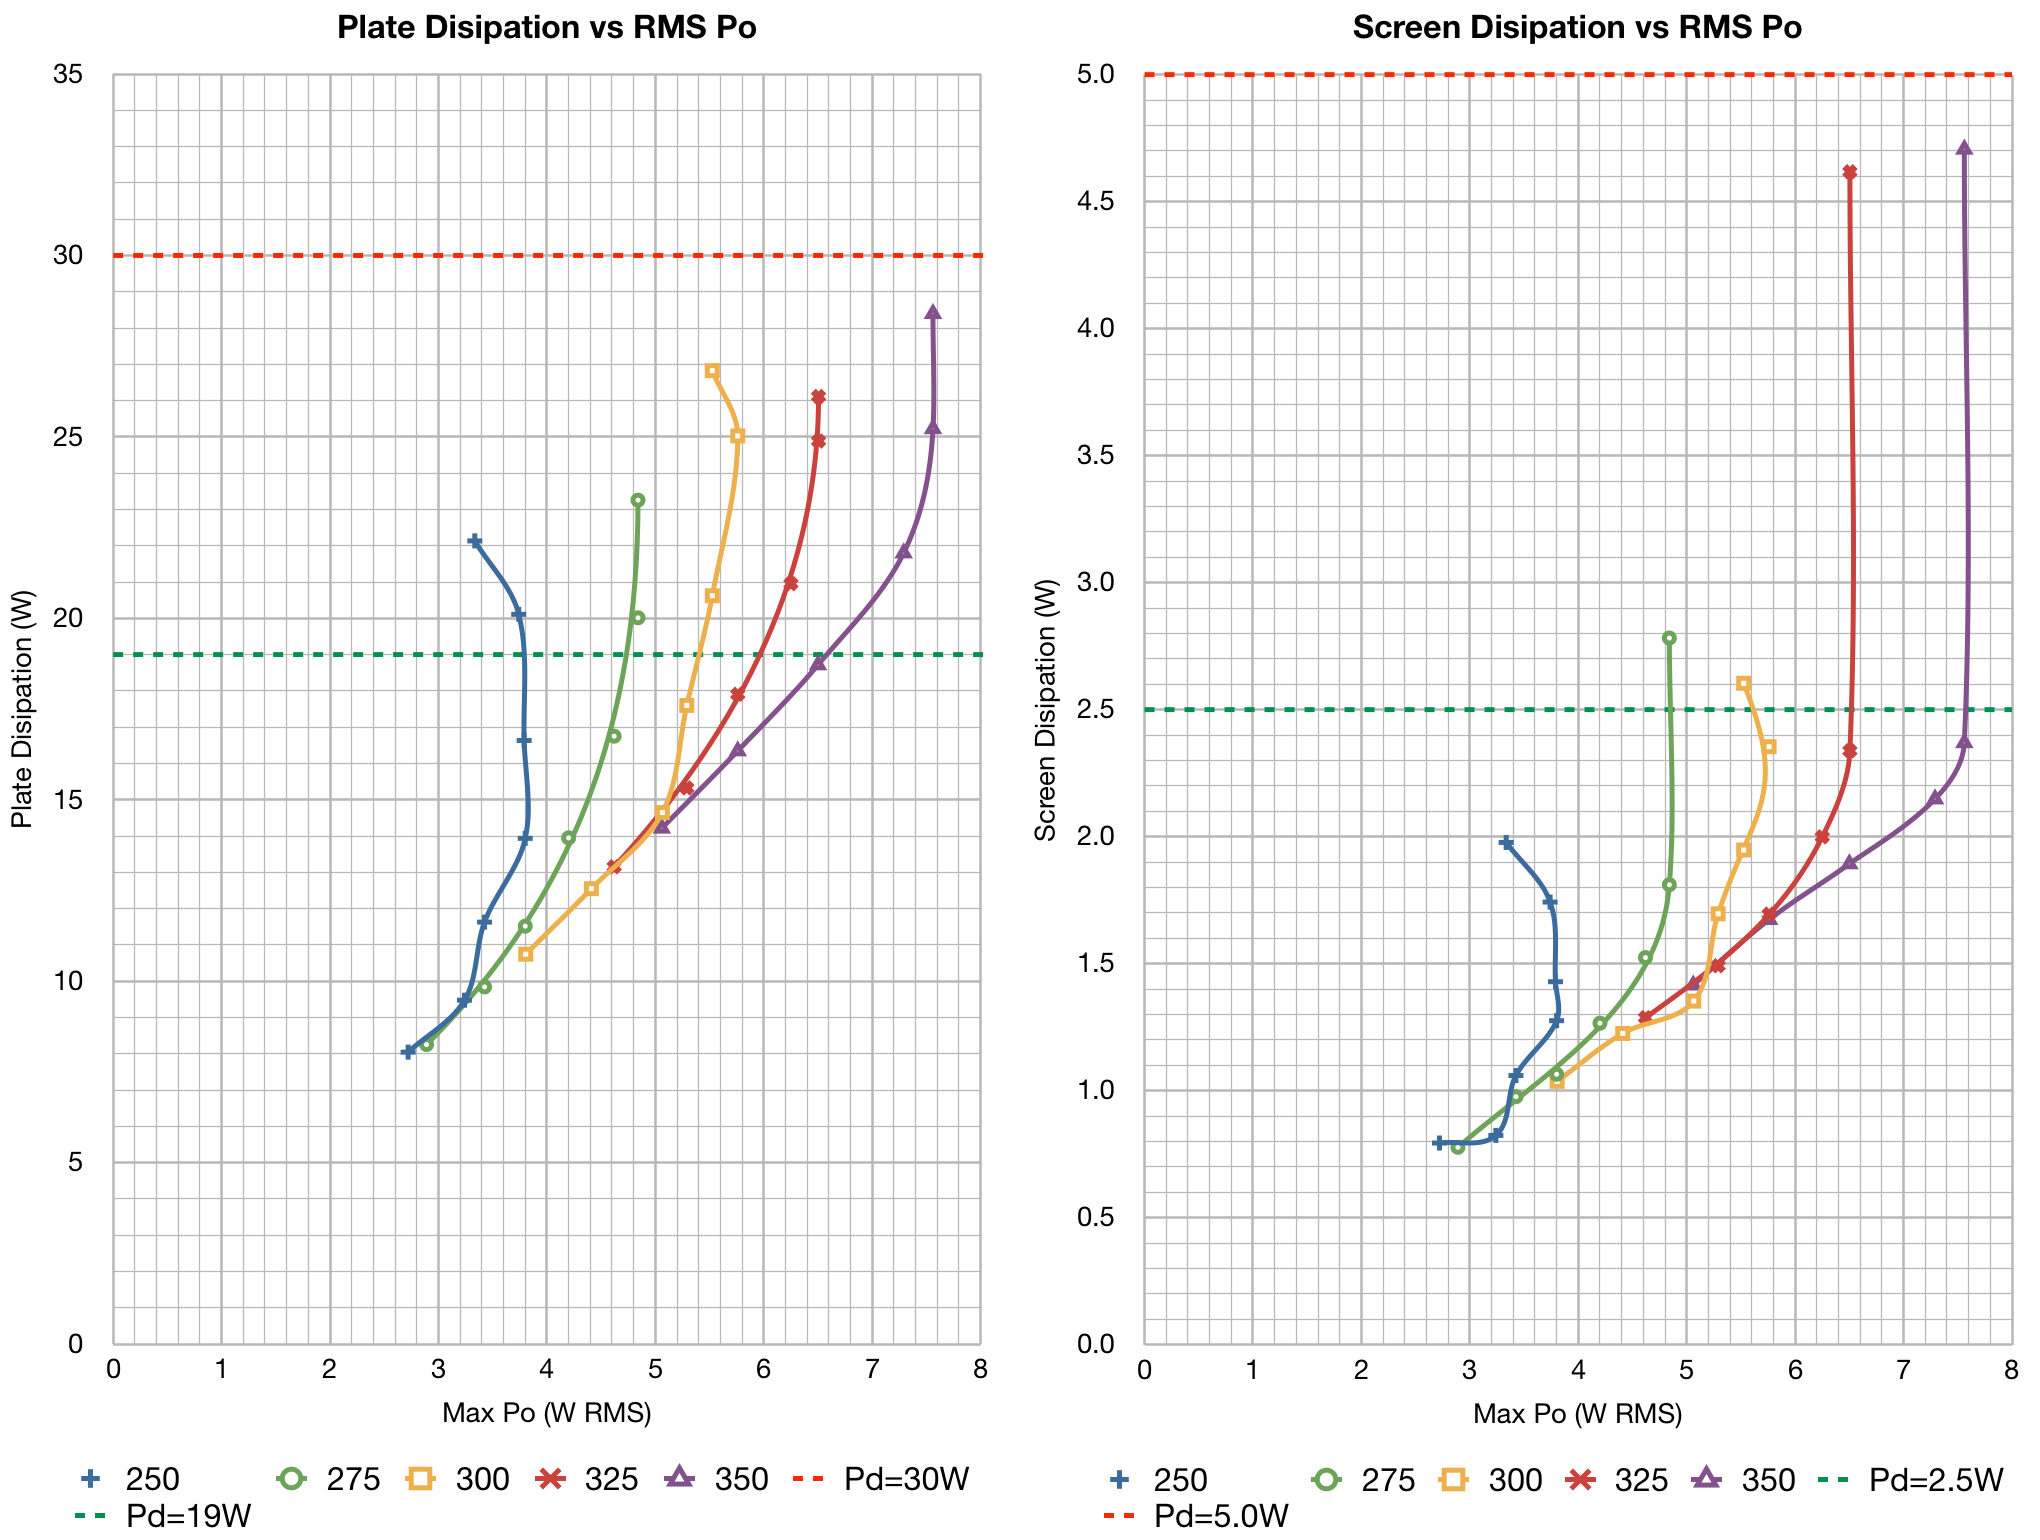
Since the discussion has shifted to power, these plots show plate and screen dissipations as a function of maximum power out instead of Vk. This allows the direct comparison of “power wasted” vs “power produced” to determine where the approximate points of diminishing returns occur. I’ve also included the maximum power indications for the older 6L6/6L6G/6L6GB (19W plate and 2.5W screen) and the newer 6L6GC (30W plate and 5W screen). Of course there is also the 5881 (not shown) which is between the two (23W plate and 3W screen). In these plots, along each Vp contour, the maximum Vk vales are at the bottom with Vk decreasing as element dissipation increases
The first thing to notice in this data is that for each plate voltage curve, there is clearly a point of diminished returns where increasing Vk further produces no more or even decreases output power. In addition, at the higher plate voltages, it is clear that there is a very nonlinear relationship where the screen begins to dissipate significantly more power. This is likely due to the beam plate controlling field reaching its design limits and increasing electron flux from the cathode impinging on the screen grid. Clearly, these points should be avoided in operation.
The other point of interest concerning dissipation is thatat no time, with the exception of the very lowest values of bias voltage, did any of the configurations have a screen dissipation in excess of 2.5w. This low screen dissipation power seems to be a basic characteristic of UL operation. As such, screen resistors should not be required except in very special circumstances.
The other data set of interest is the plate and screen current vs power curves. This data is important for power supply design and if you are using smaller output transformers which may have a saturation current limitation. Here is what the data looks like.
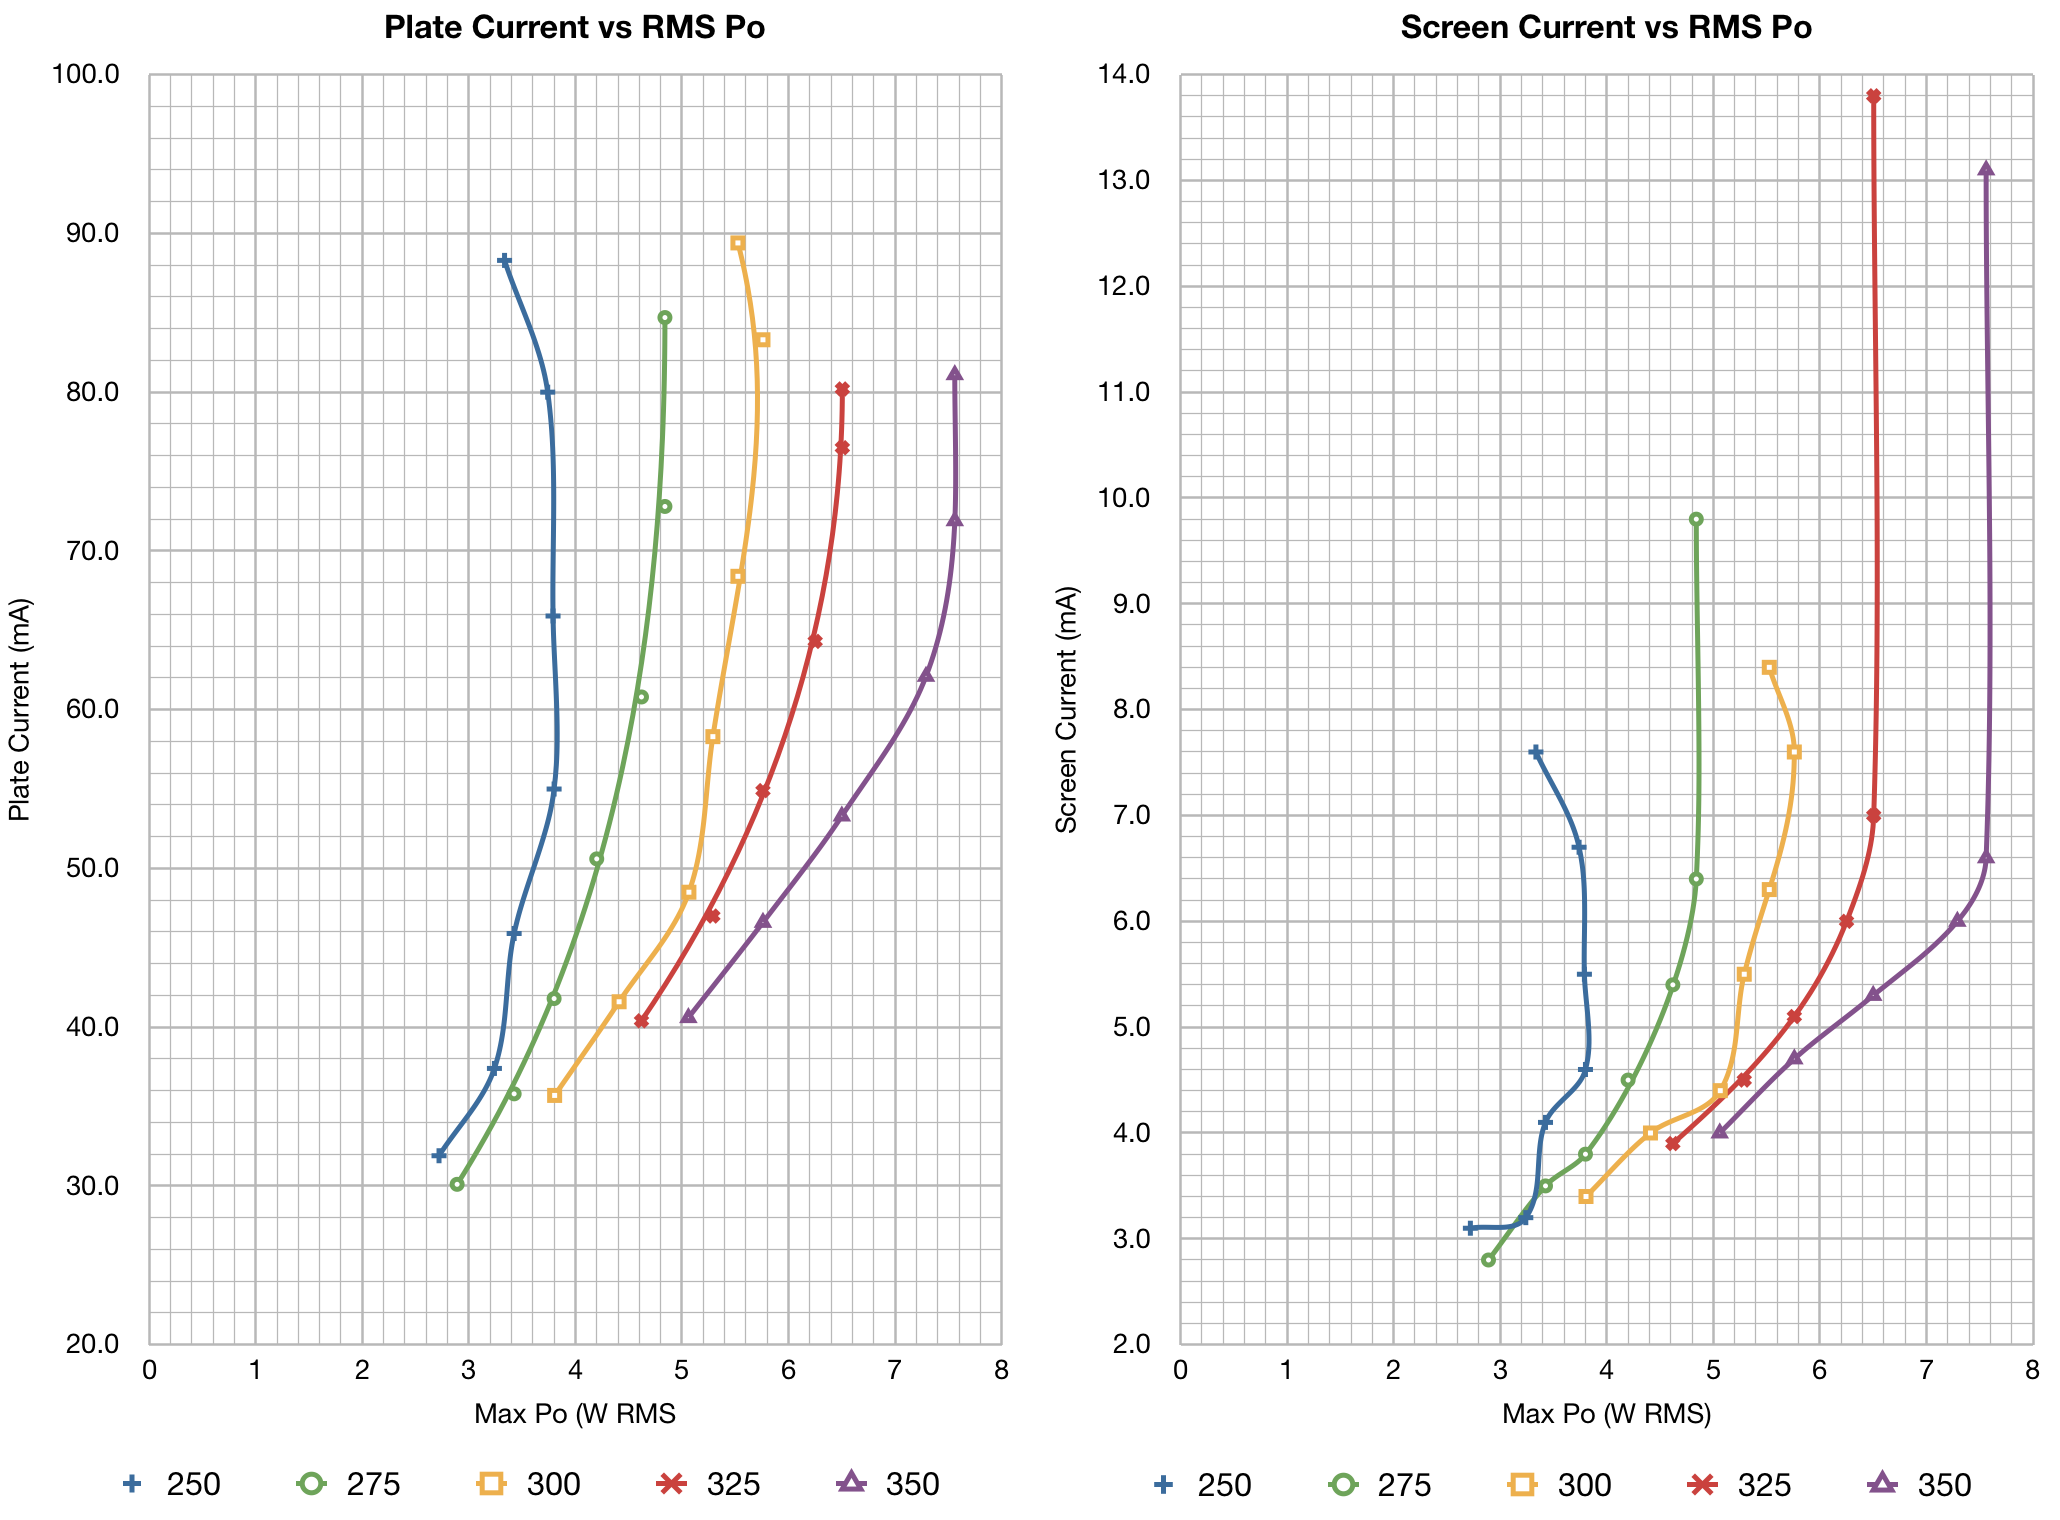
These curves are very similar to the power curves above. In these curves, the breakdown of screen function is evident as it was above. Additionally, it appears to be manifested at the lowest Vk point on the Vp=275v curve as well. These are operation points should clearly be avoided if possible.
The Optimization
So the only thing remaining is to put all this data to good use to arrive at some points of optimization. Unlike the 6V6 SE-UL optimization, where I endeavored to achieve a balance between distortion and power, for the 6L6 the distortion values are mostly irrelevant being as small as they are. As such, I have sought to select points from the data set which represent near maximum capability (i.e. maximum power out) at each plate voltage, while avoiding those points showing abnormal screen operation.
In the optimization data that follows I have chosen from each plate voltage series, a single bias point which I believe reflects the best tradeoff between achieving peak power out and maintaining good tube performance at that plate voltage. These individual points are then folded into a single data set which represents a set of optimized conditions for the 6L6 operated in a cathode biased ultra linear configuration with a 5kΩ load transformer.
All parameters are plotted against the tube operational plate voltage Vp. Please note that this is not B+ voltage but the actual plate to cathode voltage. This distinction allows this data to be used for a fixed bias configuration as well, with the understanding that the distortions my not be quite as good. I present the data in three different pieces. The first, is a plot of the optimum bias voltage (Vk) verses the plate voltage. This plot shows how the bias voltage should be changed as plate voltage is changed.
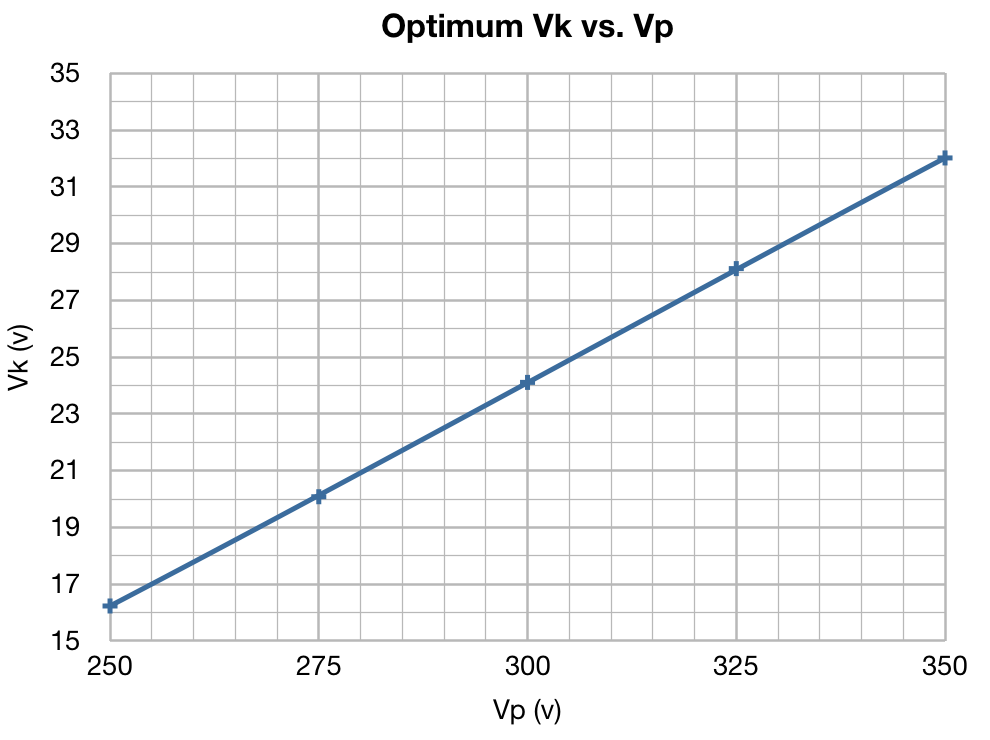
This plot shows that the progression of Vk as Vp increases is fairly linear. I believe this to be a good result because it shows that the optimization point of the tube changes proportionally to circuit voltages. This implies that these optimized operating points really are related to the inherent structure of the tube and not to some chance circuit configuration. The other important thing to note is that the optimized bias voltages are significantly greater than those generally published for pentode operation. For example Vp=300v and Vk=-12.5v for pentode operation from the GE 6L6-GC March 1959 data sheet verses Vp=300v and Vk=24v for UL operation above.
The next set of plots show how the circuit behaves at these bias points. These plots show peak RMS power output at each point, the plate current, and the screen current levels. Here are the plots.
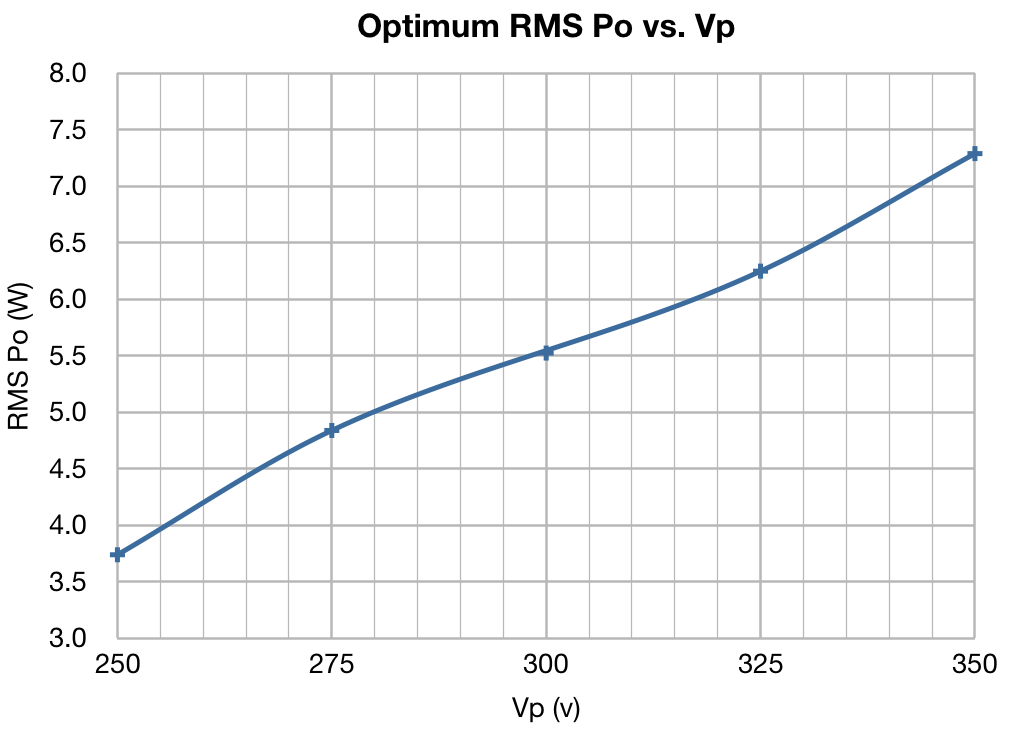
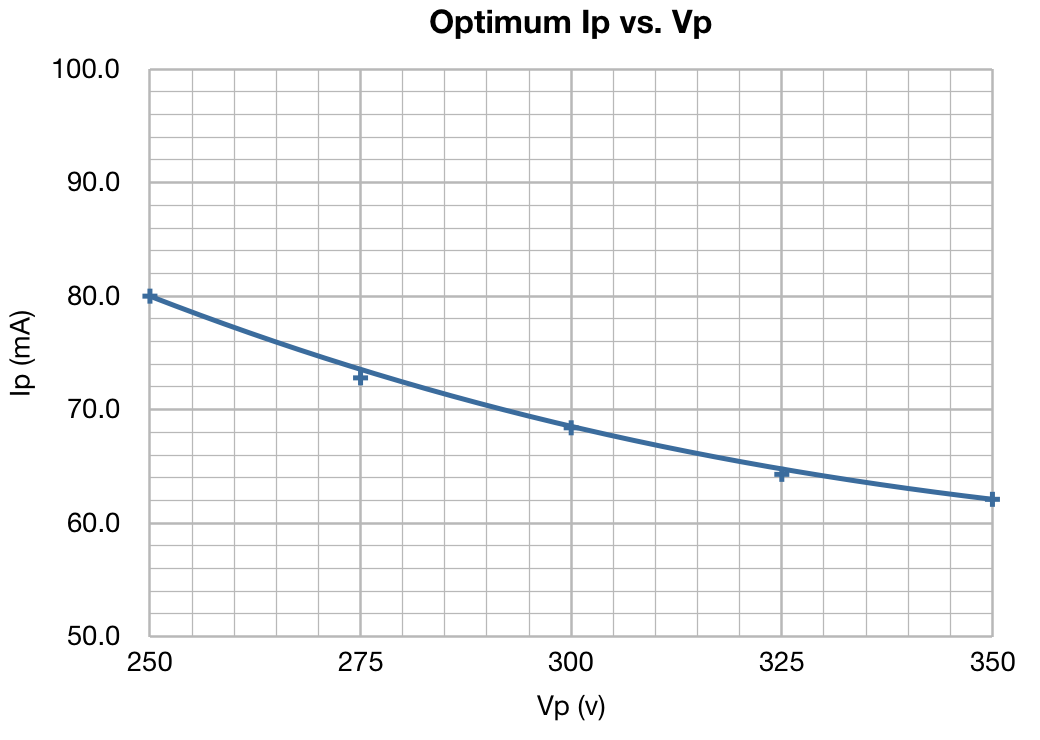
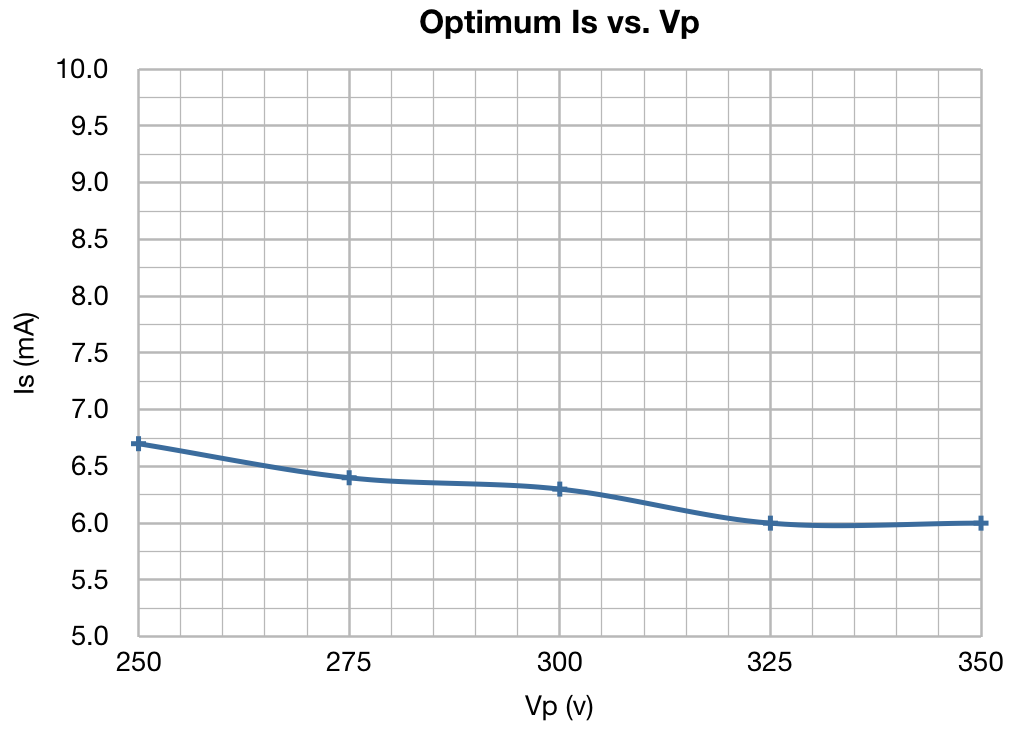
These results again illustrate the relatively linear relationships between optimized operating points and tube voltages (and current) noted above.
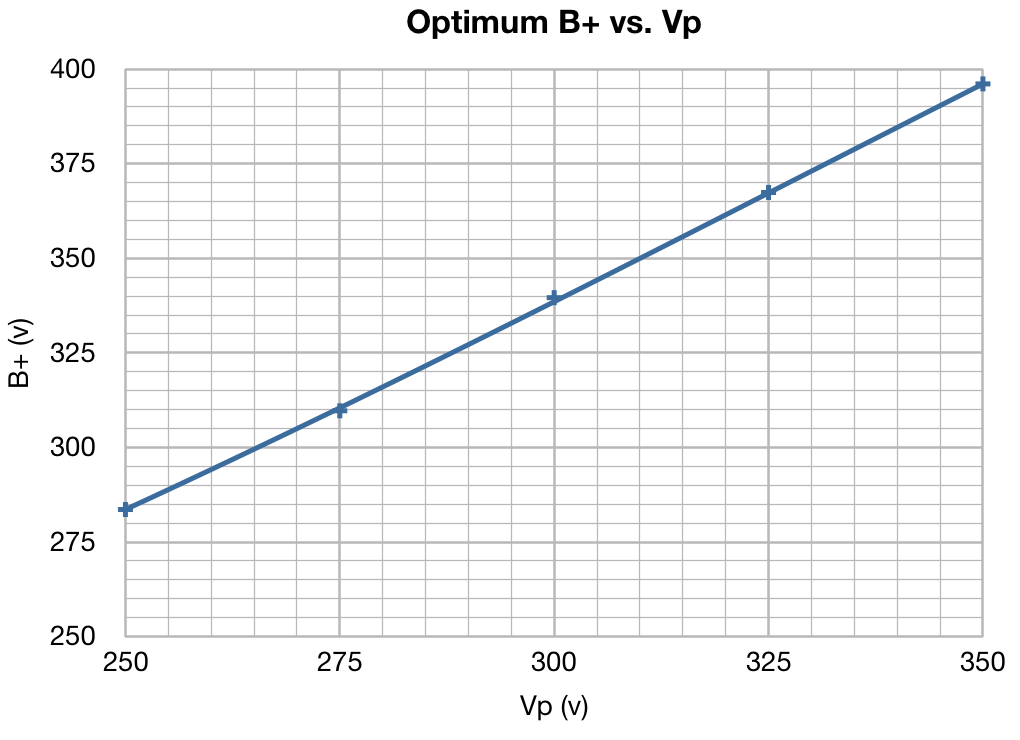
The final two plots concern the choice of circuit parameters to achieve these operational conditions. The first is a plot of the B+ voltages used to achieve these circuit conditions. As each bias was dialed in, the B+ was adjusted to ensure that the plate voltage was maintained very closely. In all cases the B+ voltages at each plate voltage were very nearly constant; within about 1.8v for all bias voltages investigated. And the second plot shows the all important cathode resistor value at each optimized bias point.
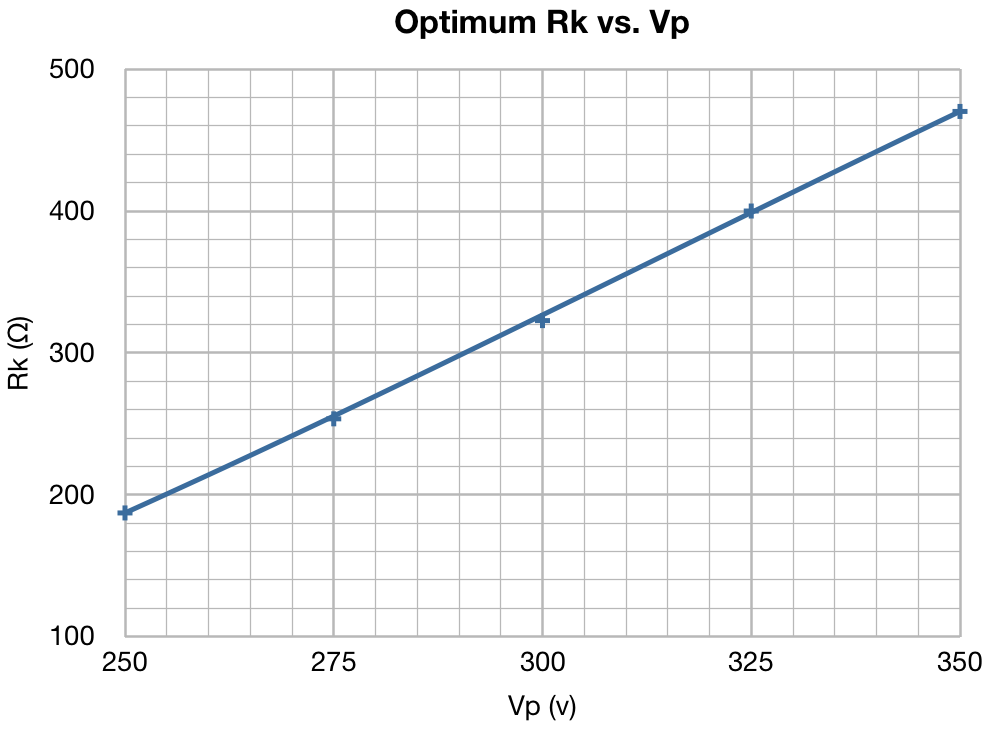
It is very interesting to note that value of Rk for optimized operation varies significantly verses Vp. The variation here is from 187Ω to 470Ω; the value more than doubling. In the case of the 6V6 this variation was only 9%.
And finally here is the data I used to plot the optimized operating curves. I have included some more data here than I did in the 6V6 optimization report, which may be of interest.
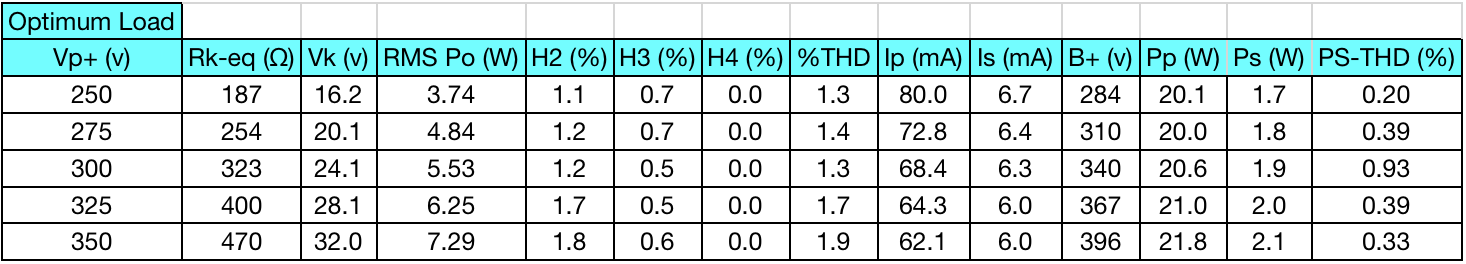
This data should be suitable for all 6L6GC and 5881 tubes. Please note that these operating points are not suitable for the older 6L6/6L6G/6L6GB tubes. The plate dissipation here is too high for these older tubes.
Conclusion
So this data set turned out to be somewhat different from the first set for the 6V6. First, I learned that the 6L6 can be very low distortion in the SE-UL configuration, which was a pleasant surprise. Secondly, I realized that it can produce some reasonable power levels to satisfy those with a desire for such. And I now have a complete set of data on how to bias and operate the 6L6 in the SU UL configuration (at least at one load impedance) for my future builds.
Like the 6V6 optimization before, I consider this a successful endeavor. As I start my next design I won’t have to just use pentode bias points and hope for the best. I’ll be able to consult the data I collected and intelligently chose an operating point that meets my design goals and works well with the rest of my design. My hope is that others will also find this information helpful as they start their own 6L6 SE UL builds.
Hello, have you seen this 6Y6G Distortion vs Load chart ?
https://imgur.com/a/rtqbZ9Y
Also the Harmonic Distortion videos by DeepBlueHarp
https://www.youtube.com/playlist?list=PLWtilvqU0-yzBvIamk3mS7f3KZkm5dv86
cheers.
The chart you linked is actually directly out of the Tung-Sol 6Y6GA data sheet. Tung-Sol published these curves for several of the more common beam power tubes. They show the characteristic distortion and power characteristics which are a consequence of rotating the load line about a single operating point. I find these plots theoretically interesting, but of limited practical utility. I say this because for any particular load, the operating point should be adjusted for the desired operational characteristics. By holding the operating point constant they have constrained the data in a manner inconsistent with actual design practices.
I had not seen the videos you linked but they seem to be a reasonable introduction to distortion generation in vacuum tubes.
I see you tried different operating points “Looking at the various data sheets, I decided on the following five values of plate voltage (i.e. the DC voltage between plate and cathode pins): 250v, 275v, 300v, 325v, and 350v. At each plate voltage I varied the bias voltage and collected data on power out (in the 8Ω load), harmonic distortion, plate and screen dissipation, and current levels.” but what about different screen grid tap percentages? I see the transformer you are using has the taps at 40%. What about 43% or 37%?
The simple answer to your question is because the 40% UL transformers were commercially available. In addition, since previous work has already shown the most effective screen tap locations as ≈40% and ≈20% I saw no reason to repeat previous work.
The more in depth answer is that the previous investigations have shown little advantage of increasing the screen AC excitation beyond the 40% point. This simply decreases power and gradually increases 2nd harmonic distortion, while marginally lowering the higher order harmonics. Going the other direction (i.e. lowering the screen AC excitation) typically shows some advantage in increasing power but at the expense of higher order harmonic reduction. The acknowledged “sweet spot” (for want of a better term) being ≈20%. However, since the point of my designs is optimization of harmonic structure and seldom to maximize power I chose the 40% winding as my baseline.
Thanks for your study!
I recently built such amp and it looks like my data is pretty close to your optimal.
My load is 3.5k and I may lower Rk to 300 but I think it is still fine as it is now 😉
The overal THD was like 2.1% if I measured it correctly.
Regards!
https://pixhost.to/show/49/301523305_amp.png
I’m glad your amp turned out well.
It’s always good to have some separate confirmation of my work. Let me know if you have any questions about the data set or how I arrived at my numbers.
Hi Matt,
Thanks again for your work in optimizing the 6L6-GC for SE-UL operation and the resulting amp schematic. I completed my build and I must say that the amp sounds very good, very pleasing. I listened to it for a few hours on my test speakers, a pair of 30-year old Minimus-7 speakers from Radio Shack, and using my computer as a source. Even with the little speakers, the sound is very good.
The amplifier circuit uses all component values that you specified. I went a little different route on the power supply. An Edcor XPWR008 (600 volt CT) PT feeds a pair of UF4007 diodes, a 47uf first cap, and a 5 henry (Hammond 193H) main choke. Past that, I used the same topology of as your Lacewood V2.0 amp, changing only the value of the dropping resistors for the driver B+ (43K). Voltages:
B+ – 393
B+ (driver) – 342
Driver plates – 229
6L6GC plate to cathode – 352
6L6GC – cathode to ground – 31
Very rewarding project! I may post in on the DIY Audio Projects forum, along with a couple of pictures.
I’m glad the project worked out so well. I look forward to seeing some pictures.
Quick question::
Is the B+ of the output valve (6v6) 292v or 300v?
The Marblewood Amp B+ voltage is +300V dc. This is listed on the schematic of the power supply.
I am sorry for posted at wrong place. In the Marblewood schematic, the power supply has two output voltages: 292v and 300v. I understand that 300v is to be wired at output transformer and 292v to pre-amp anode vacum tube. Is that correct?
That is great information! I’m gathering parts…:)
Hope that you do a similar workup on the EL34. Really nice sounding tube and reasonably priced.
The EL-34 is next on my list. But I’m a little distracted by SETs at the moment. It might take until sometime this summer for me to get around to it.
Sounds good Matt!
Hello and thanks again for all your work on the subject. I’ve been working on a 6L6GC SE amp of my own, here’s the schematic:
https://imgur.com/tKNwa8z
With a Vp of 335v it sits at the high end of your data set but I must say it puts out a ton of clean power, a bit too much for my living room. I’m currently accumulating the parts for a v2 Lacewood Amp, eager to see how it plays.
Would you have any suggestions on the driver stage of my design, to decrease the input sensitivity? It’s easily overwhelmed by a 834 phono stage, harsh distortion.
Thank you very much great. What I would also be interested in: The dependence of the bias current on the frequency linearity. BR
The simple answer is that the dependance is small. The point of backing out the driver stage distortion was to illustrate that the 6L6 in this configuration shows little distortion dependance on bias condition. This means that the sensitivity of the distortion (or frequency linearity) with bias condition is small. As such, it is a poor choice of characteristic upon which to perform the stage optimization. This is what I meant when I said:
If you are choosing a bias condition, you should use parameters other than distortion (i.e. frequency linearity) to make your selection.
Some incredible work here, thanks.
I think your THD measurements can not possibly be correct.
That is an interesting assertion. I would like to understand your reasoning for why the distortion numbers should be wrong; or as you say “can not possibly be correct“.
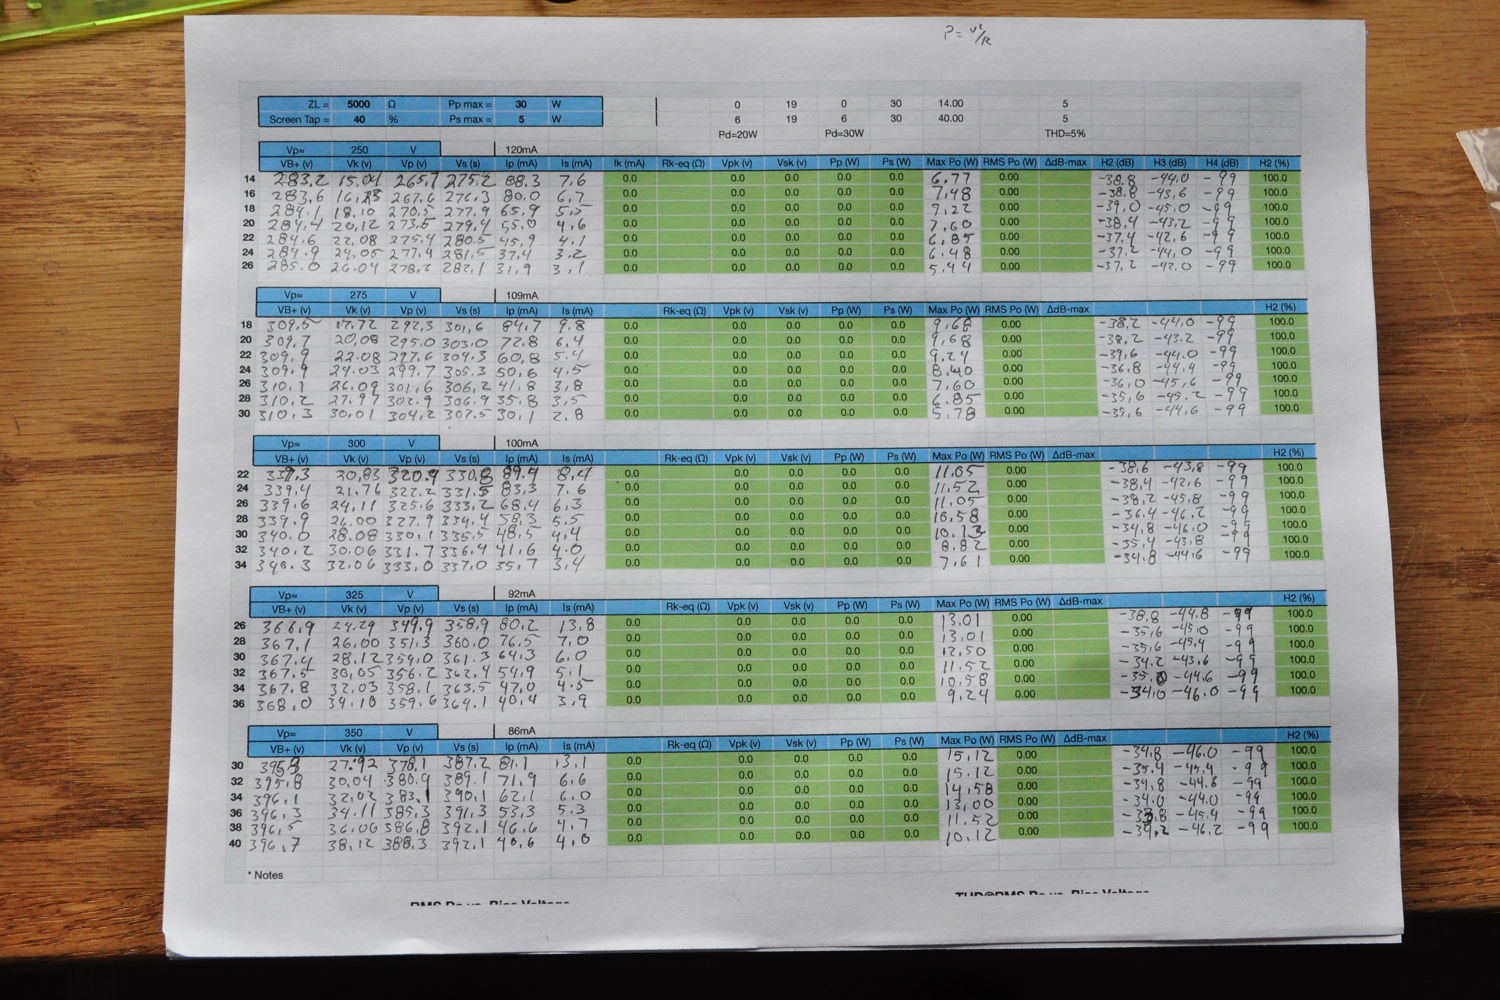
This is a relatively strong assertion. As you can see from the web page, this is not some simulation or mathematical analysis model but actual measurements from a power stage using a new JJ 6L6GC and an Edcor output transformer. I have checked the FFT function of my oscilloscope against a calibrated comb filter and the FFT seems reasonably accurate (±0.5dB or so). And in the comments you can see the image of the actual sheet upon which I recorded all the data. Perhaps you believe there is something wrong with the test setup, data, or analysis?
You may take issue with the manner in which I attempted to back out the driver stage distortion. However that is the reason I provided both sets of distortion numbers so that readers could make their own assessment (i.e. %THD and PS-THD(%) ). I assure you however, the mathematics I used are correct.
I look forward to reviewing the evidence to back up your assertion.
How can I send you ap graphs? How can I attach photos or pdf graphs?
Your distortion is way too low, I am currently working on a 6L6 se amp.
Best regards,
Art
You managed to put a lot of information in a format that even a non-technical person like myself could follow. Thank you!
Interesting setup and nice box.
What type of instrument do you use to measure distorsion?
Thanks
I use the FFT display of my digital oscilloscope. I read the individual harmonic levels in dB relative to the fundamental, convert that number to a percentage, RSS the results, and convert to percent. I usually collect the data and I have a spreadsheet that does the conversion. This way all I have to do is enter the levels of the harmonics and the spreadsheet does the rest.
Very nice and useful analysis. I have being experimenting with the 6L6 for almost 3 years now and came to similar conclusions as you. One may run it with higher BIAS as recommended in many data sheets. I also made the experience that a higher load is also of benefit. Anyhow my observations are that up to 350V plate voltage 3.5kOhm is very good and higher then 350V 5k works better. Again thanks for your efforts.
Excellent analysis. Like you I only went to 400V and I agree with your results regarding power, cathode resistance etc but I don’t think your THD results are quite correct. I have a professional distortion and noise meter and low distortion signal generator. I find using a scope and FFT is not that accurate. Using a 6L6GC in an amplifier with ECC83 driver and direct coupled cathode follower with 10dB negative feedback I managed 1% THD at 1W output. At 4W with 300V 5%, 8W with 400V still 5%. None the less the little ultralinear amplifiers sound great. I am using Tango output transformers. Thank you for your great analysis.
I’m glad that you enjoyed the article. More important than the absolute distortion levels (in my opinion) is the pattern of distortion verses other factors during testing. For the optimization it was necessary to monitor the distortion along with the other factors. However, in general I don’t spend much time measuring distortion in my amplifiers except for a spot check at one frequency. I rather depend on my ears for the overall sound.
I agree that the digital scopes can be subject to a myriad of idiosyncrasies which can seriously affect their accuracy. However, the scope and my methodology has generally checked out against dedicated equipment to within about 1% at these levels and in this type of test. Fully integrated amplifiers would rarely show this level of total distortion both by happenstance and, in my case, by design.
Quick question:
On the final chart in this write-up, the far right column, what is “PS-THD”?
Another question:
Any chance to test a 7027A (“hi-fi” version of the 6L6GC)?
Interesting that UL operation gets almost as much power as straight single ended pentode mode as the tube manuals state but with very low distortion. (8w at 15% vs. your 7.3w at < 2%)
Looks very promising for sure!
The data field “PS-THD (%)” is the residual power stage distortion after backing out the linear regression fit to the measured driver distortion. This was my attempt to estimate just the true power stage distortion. I think the lesson is that the power tube distortion was very low regardless and as such, was not useful as an optimization parameter like it was for the 6V6.
As for the 7072A, I seriously doubt there would be much difference for the values measured. The chief benefit of the 7072A was increased operational voltage and slightly higher plate power. These characteristics were better served by the 5881. Further, since the process I use requires taking a copious amount of data (see image) I am going to reserve my efforts for tubes from a different family.
I think the next one I may try is the El34.
Thanks!
EL34 is a good choice, like the 6L6GC, still in current production, and not going to disappear any time soon.