These last few days I’ve been working on the driver stage and overall schematic for the new 6L6 SE-UL amplifier. While drawing up the schematic yesterday, I inserted a 250kΩ volume control at the input without much thought. While performing some preliminary analysis, I realized my mistake.
The power stage for this amplifier is based on the data from the 6L6 Optimization Study and, as the driver for this amp, I selected the 6SL7 twin triode as I explained previously. The signal chain itself is very clean and there is little need for coloration so I simply placed the volume control at the input before the driver stage. The decision was almost automatic.
In general I like to use as large an impedance on the input as I reasonably can. In part this is because high input impedance makes the amplifier easier to drive. This explains my propensity for using 250kΩ volume potentiometers at inputs. This value is a nice compromise between the standard values of 500kΩ which can cause noise issues and the 100kΩ which means you have to watch driving impedances more closely. And on amps using miniature form factor tubes this is usually not an issue. But when going to the larger octal twin triode a problem arose. And that problem is all about the inter-electrode capacitances of the triode.
Electrode Capacitances and Miller Effect
As a general rule, the bigger the tube (at least the electrical parts), the bigger the inter-electrode capacitances. If you compare a similar miniature triode with the 6SL7 it bears this out. The 5751 dual triode is a very similar triode to the 6SL7 in a 9 pin T-6½ size glass bulb. Even though the triodes are very similar in performance (µ, rp, & gm), the inter-electrode capacitances of the 6SL7 are at least twice as large. And this affects high frequency response.
The effective input capacitance of a common cathode stage is determined by the inter-electrode capacitances and the amplification of the stage. This is caller the Miller Capacitance of the stage. At the driver stage bias point, the 6SL7 input value of 3.4µµf, the grid-to-plate value of 2.8µµf, and effective stage amplification of 42 yields an input Miller capacitance of 123.8µµf (3.4 + 2.8 * [ 1 + 42] ). I immediately recognized that this may be a problem.
First Stage Input Loading
Everything connected to the grid of the driver contributes to the impedance load that the tube sees. This includes the grid stopper resistor, the volume control, and the output impedance of whatever is driving the amp. All these impedances interact with the Miller capacitance of the tube to limit the high frequency response of the stage.
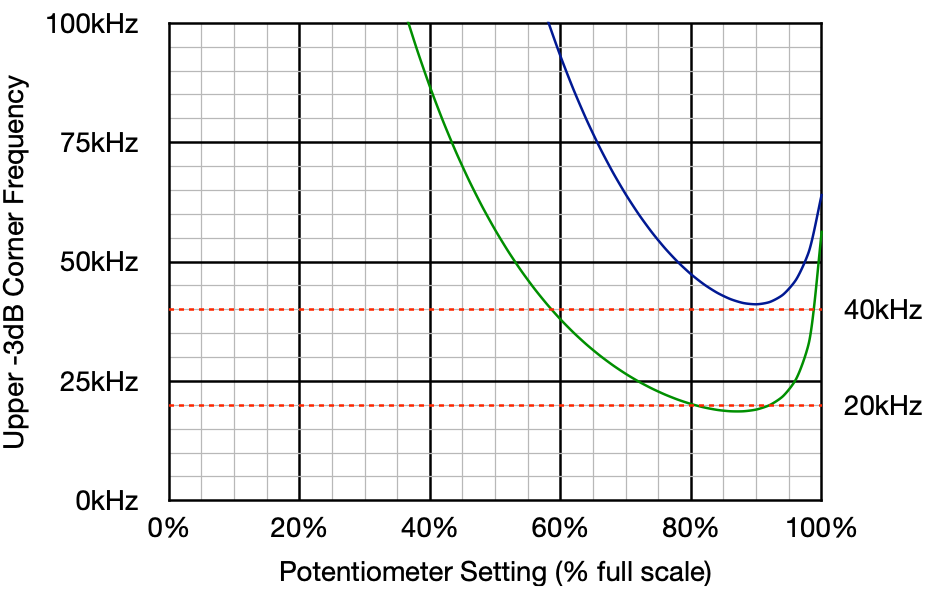
This is not easy to visualize, particularly as the control setting changes, so I thought I’d give an example. For this example I have assumed the 123.8µµf of Miller capacitance of the driver stage design, a low impedance driving device with a 600Ω output impedance, a modest 1000Ω grid stopper, and two different volume control values; 100kΩ and 250kΩ.
First, here is the output impedance of the two volume controls including the 600Ω driving output impedance. This shows how the impedance changes as a function of control setting. The lower blue line is for the 100kΩ control and the green line is for the 250kΩ control.
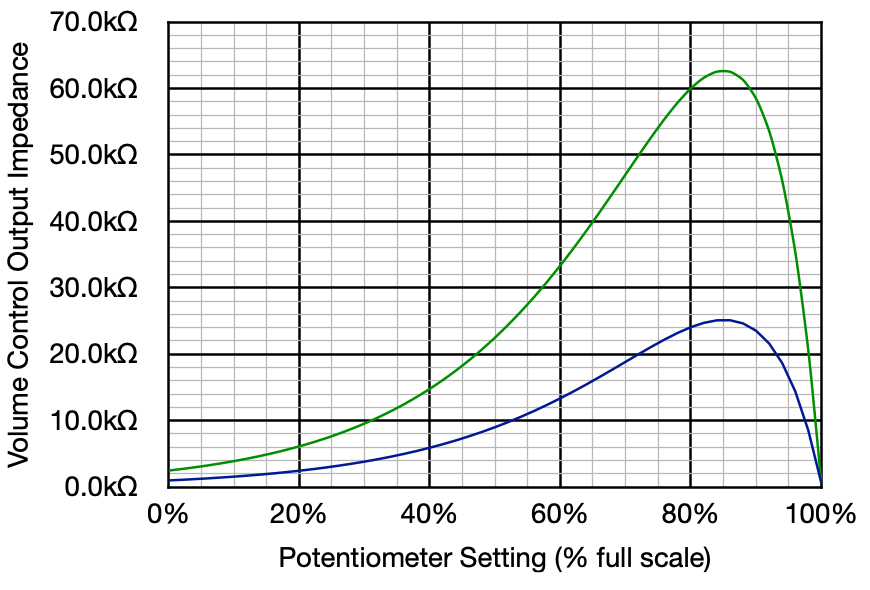
It is the higher green curve which gives me concern. This represents the initial control value chosen; 250kΩ. The control impedance will push the high frequency response lower at higher volume settings and, at these impedances, it may unacceptably impinge on the upper audio band. This is something I don’t want to happen.
So I then generated the high frequency response curves for both controls under the same assumptions. This yielded the following data.
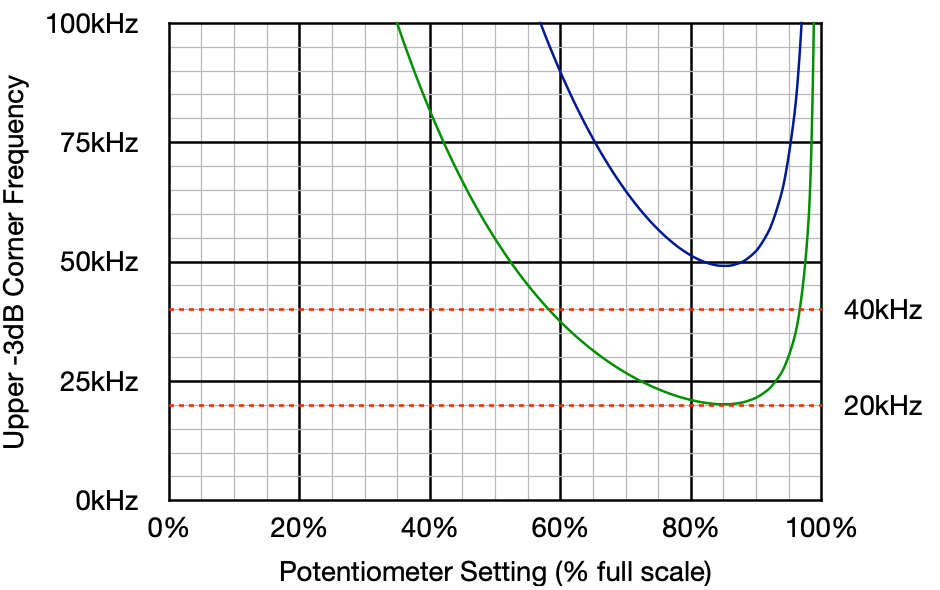
The two reference lines are important. The lower is at the upper end of the audio band, the other is one octave higher. At first glance, one may assume that the situation is acceptable with both controls because the audio band below 20kHz is clear. The lower green line for the 250kΩ control bottoms out at approximately 20.2kHz. But that is not necessarily the whole story.
Remember the nice 600Ω driving impedance? What happens in the situation where there is a small tube preamp driving the amplifier? Such a preamp could have an output impedance of several tens of kΩ. In the following plot, I reran the numbers with everything the same except I inserted a modest 15kΩ output impedance driving the amplifier. This value could be considered typical of a well designed tube preamp. Here are those curves.
Now, with the increased driving impedance on the amp, the high frequency response curve drops to approximately 19.1kHz. One could argue that this is still not much of a problem because it’s still rather high and may well be imperceptible. But there are some other considerations to be addressed.
-3dB Points and Cumulative Losses
The first thing to realize is that the data plots above show the -3dB values of frequency response. What this means is that at that frequency, the power out of the amplifier will be cut in half. It is a reference point. There will still be some loss at least an octave lower in frequency than this point. It is a good idea at this juncture to look at what frequency response actually looks like in the vicinity of that reference -3dB point.
The following plot shows frequency response for the circuit at the single volume setting giving the worst performance (i.e. -3dB at ≈ 19.1kHz). This response is shown by the blue curve.
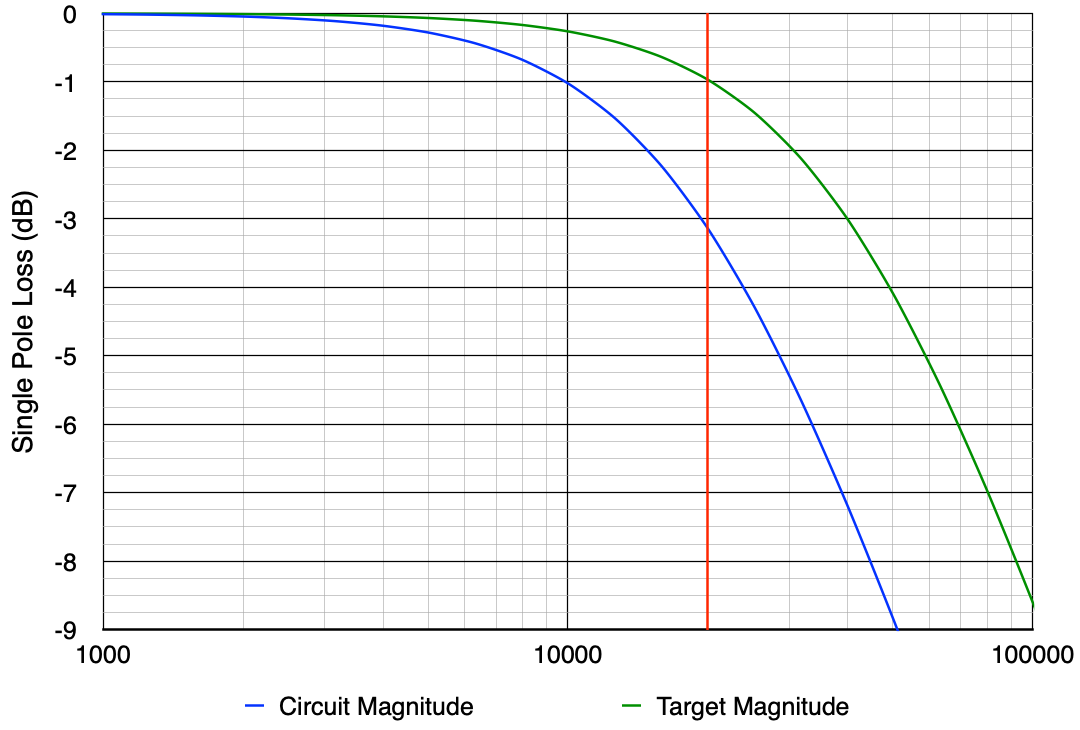
Here the blue curve crosses the -3dB line at approximately 19.1kHz. However, the curve also shows a full 1dB of loss one octave lower at 10KHz. And this brings us to the other problem.
This is not the only high frequency loss point in the amplifier. The high frequency response of the amplifier will be limited due to the first stage Miller capacitance, but it will also be limited by the second stage Miller capacitance, and it will be limited by the high frequency response of the output transformer. And all of these effects are cumulative. If one were to allow -3dB @ 20kHz for each point. Then the complete amplifier would be down 9dB at 20KHz and a full 3dB at 10KHz. Clearly an unacceptable situation.
This brings discussion to the green line in the above plot labeled “Target Magnitude”. This is a rolloff characteristic with the 3dB point placed at 40kHz. This is one octave above the 20kHz point. This curve has 1dB of loss at 20KHz and about 0.2dB at 10KHz. With the three loss points described above, if each were held to this level then the entire amplifier would have a loss of 3dB at 20kHz. Clearly a more acceptable situation.
I personally think that placing the 3dB point no lower than 40kHz at any single point is a more reasonable design rule. This is reason for the 40kHz reference lines on the plots of frequency by control setting. In these plots above, it is clear that the 100kΩ control keeps the high frequency -3dB reference point well above 40kHz and thus limits losses at 20kHz to less than 1dB.
This would seem to indicate that the 100kΩ volume control is the right choice from a frequency response perspective.
Final Check
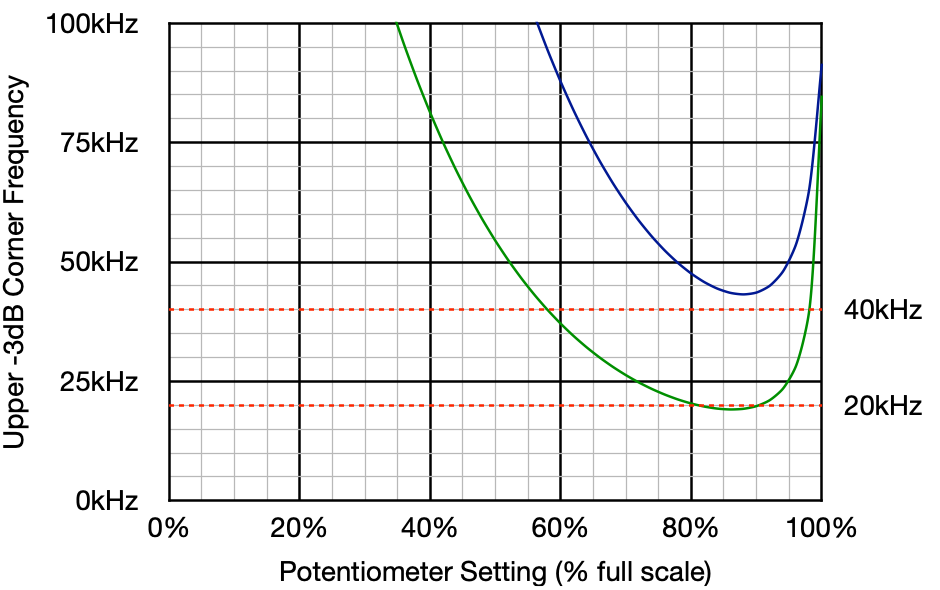
As a final check I reran the numbers with both volume controls, a driving device output impedance of 25kΩ which just meets the 4:1 cascaded impedance rule (for the 100kΩ control), the same 123.8µµf Miller capacitance, and no grid stopper resistor. Here are those curves.
Here the low frequency response for the 100kΩ control stays above the 40kHz limit (bottoming out at about 41.1kHz). The 250kΩ control bottoms out much lower at ≈18.7kHz. Clearly the 100kΩ volume control is the right choice in this situation.
In Conclusion
I’m very glad I caught this issue when I did. It would be very frustrating to be looking at a limited bandwidth response from testing and trying to figure out what went wrong. It is also one of those cases where everything is not necessarily what it appears. In this case, as it is with most things, details and context matter greatly.
As always, questions and comments are welcome.
This is one of the best written articles discussion high freq response. Thanks for your effort.
Pingback: Progress on Several Fronts | Cascade Tubes
Thanks for this Matt. It’s the main reason why I tend to default to 100K for input volume control. I’m certainly not as diligent at checking and understanding as you are.
I have myself heard the effect you describe….I once restored a Magnavox console amp. For some reason I used 250K pots at input instead of usual 100K. There was a 470K grid resistor as well that I didn’t give thought to. Well, talk about a “tubby” sound! At least I didn’t struggle long finding the reason.
Really like your explorations — they have given me better insight to things I thought I understood. Cannot wait to see more of the 6L6 project. I have one in the wings, but will be PP. I have to use a set of high end output transformers.