The year was 1984. The spoof “rockumentary” titled “This Is Spinal Tap” was just released to theaters and it was then that this immortal phrase entered the modern lexicon. I’m referring, of course, to that classic line “These go to 11”.
In the intervening 40 plus years, a million and one jokes have been made about things that go to 11; including amplifiers. As amp builders we would like to know what it takes to make our amp projects go to 11. Unfortunately, the answer is more complicated than you might think.
The Volume Control
Understanding this complication starts with requiring a thorough understanding of what the volume control actually does. At it’s simplest the volume control reduces the amplifier volume. And it generally does this by reducing a signal voltage by an amount depending on the control setting. But the volume control is not a simple linear reduction.
Human hearing and perception have a logarithmic response. In order to make the amplifier settings match that sensitivity response, the control must also have a logarithmic response. This response scale has been standardized in audio electronics as a standard response called “LOG A”. This response curve gives a volume control about 40dB of variation from 0% to 100% shaft rotation.
The following two plots illustrate the same volume control response. One in terms of signal voltage, the other in terms of dB signal voltage.
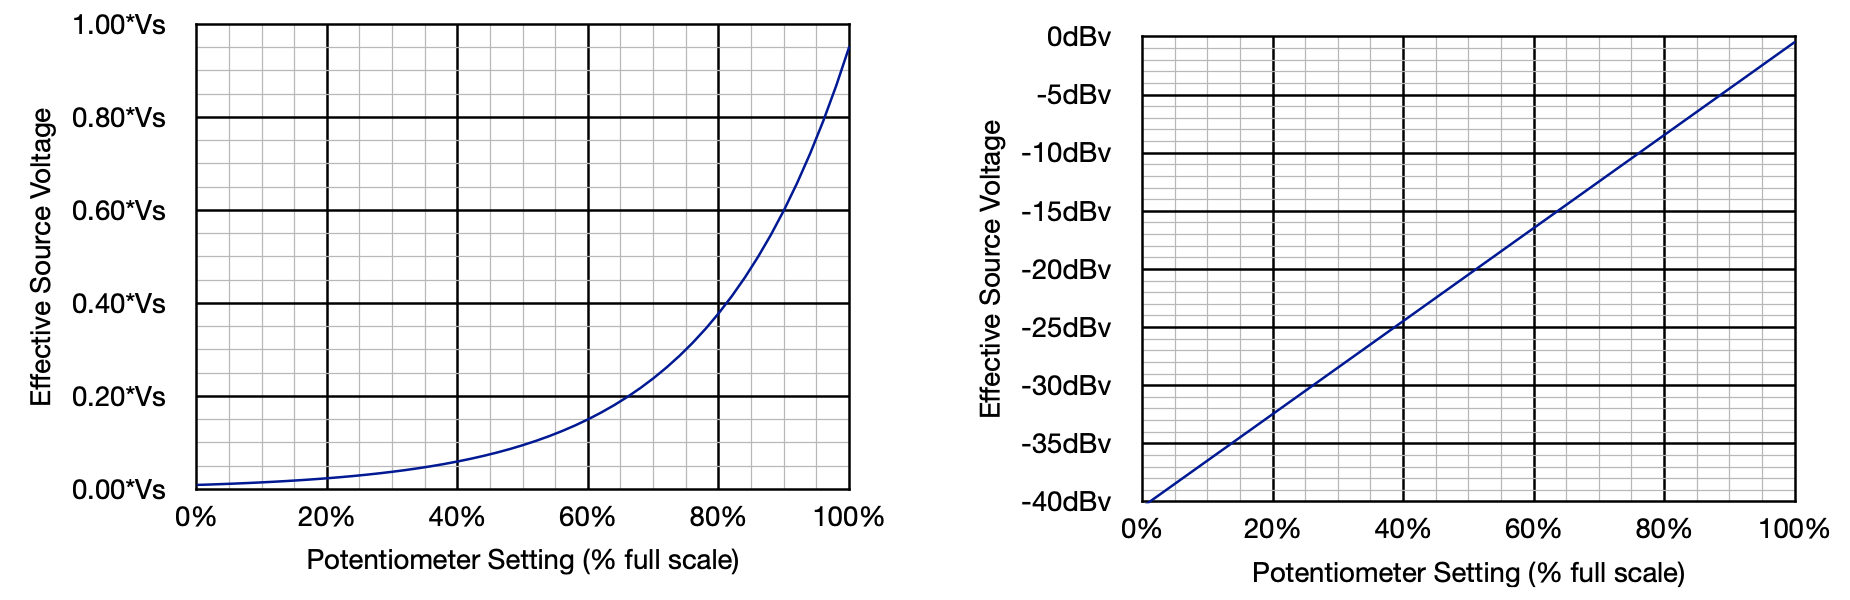
These plots are a reasonable representation of a standard volume control response. In these plots, full volume is indicated by a setting of 100% (i.e full clockwise rotation). So a volume control at “full volume” is technically just zero attenuation. At any other setting the volume control represents a loss of signal or volume (i.e. an attenuation). On the right hand plot the range shows a full 40dB of variation.
If the volume control is labeled as “0” through “10” it is clear from the logarithmic plot that each number (e.g. 3 to 4, 6 to 7, 9 to 10, etc.) represents a change of 4dB. So if we want the amplifier to “go to 11” all that’s required (other than remarking our volume control) is to increase the peak output power of the amplifier by 4dB.
It should be noted here that this +4dB change is not a significant increase in volume. In fact, many references state that it really requires a 2 to 3 dB increase to even be perceptible under normal listening conditions. So this 4dB change really is “just a little bump”. More than a perceptible change but not a significant increase.
The Amplifier
What does +4dB look like? In the simplest terms this means increasing the peak output power of the amplifier by 4dB or multiplying the peak power by ≈2.5 times. So the change involved is going to depend on the amplifier (or amplifier design if it hasn’t been built yet).
This means if your amplifier design peak output power is 1W, increasing the peak output power to 2.5W. That seems fairly simple. But what of your amplifier is already 10W? Then making it “go to 11” means increasing the output power to ≈25W. This is a major change generally involving much larger output transformers, power transformers, and maybe bigger tubes. This change is not so simple.
And what if you have a design with 6L6s in push-pull topology yielding 50W of output power? This is a fairly common guitar amplifier configuration. Now “going to 11” means 125W peak output power. This is a MAJOR upgrade. Now you need different tubes, huge output transformers, a much more substantial power supply, and all the amplifier infrastructure to go with it.
The lesson here is that, as amplifiers become more powerful, there is a point of diminishing returns. A point where that “bump” in volume is no longer worth the increased cost and complexity. The key is determining where that point really lies.
Sound Volume and Amplifier Power
The heart of the issue is related to that logarithmic hearing response discussed earlier. The response is not linear. And the louder sound gets, the more difficult it is to make the output even louder. Even by a small amount.
The plot below shows a peak sound pressure level curve verses amplifier power for an example case. In this case the assumed speaker sensitivity is 90dB/W@1m and two channels are assumed. This could be a typical case for a stereo system. Changes in speaker sensitivity or number of channels will change the absolute SPL numbers somewhat, but the curve shape remains the same.
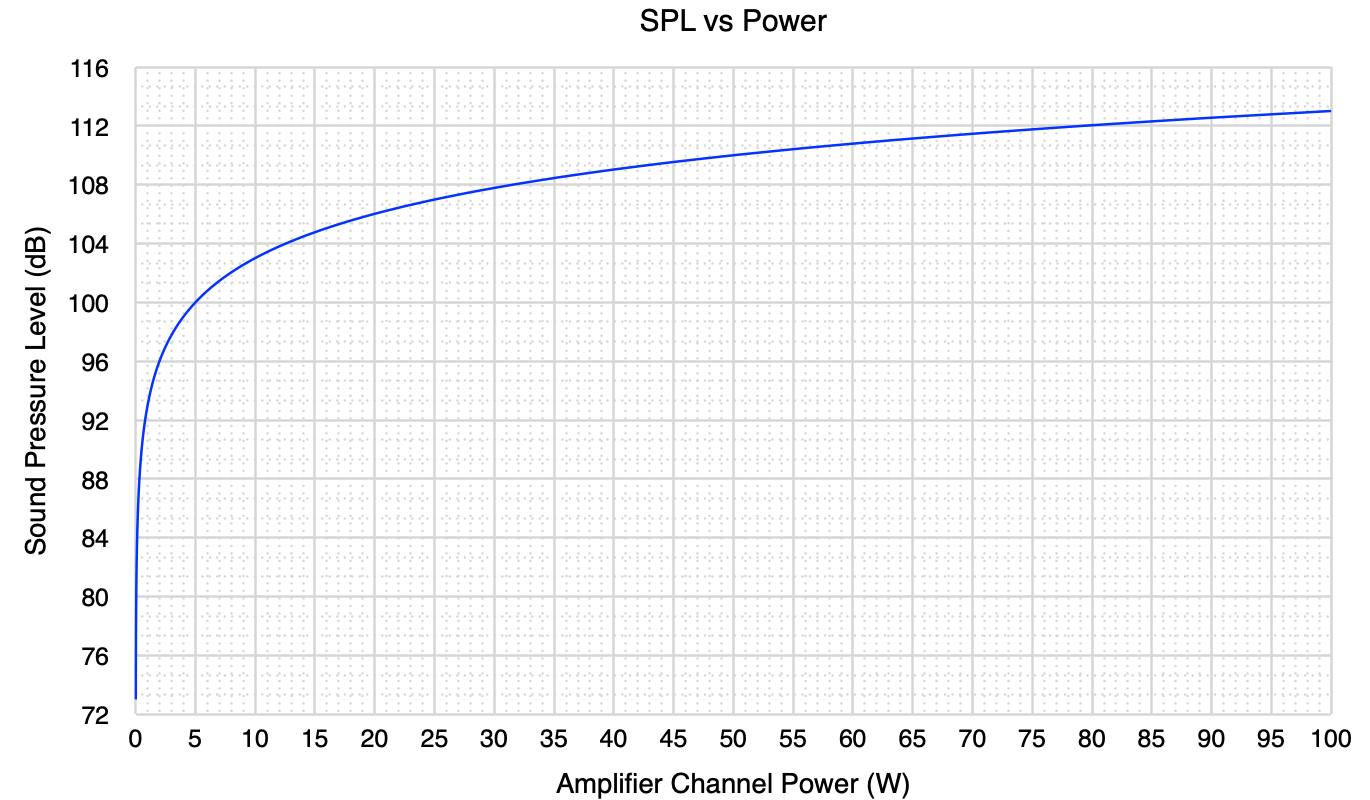
The peak channel power of the amplifier channel is across the bottom axis and the resultant sound pressure level (in dB) is marked on the left hand axis. Note that the individual steps on the vertical axis are all 4dB. So an increase of one interval is equivalent to the bump to “11”.
Spending a little time studying this graph shows the exact nature of the problem. When amplifier outputs are relatively low (e.g. under a few watts) getting that extra 4dB bump is not a major issue. At about 3 watts is where a topology change may be required (i.e. 3W to 7.5W). If you have a lower power single ended amp at 3W it may be possible to get to 7.5W with a larger tube in the same topology. But much above about 3W in a single ended amp will likely require a topology change to a push-pull configuration to get that extra 4dB.
And note that any tube change or topology change will likely radically change the sound of the amplifier. So even that example of taking a 10W push-pull to “11” (i.e. 25W) will likely require a power tube and perhaps a driver tube change both with new operating points. In my view, that not just a “bump”, that’s a new amplifier.
And as is says at the edge of the map “Beware! Here there be Dragons.”
As always, questions and comments are welcome.
Matt, Do you feel that the more prudent choice for +4dB is more efficient speakers if yoou have the space in your room?
In general, yes. However 4dB is such a small change that it’s really not required unless you already run your amp wide open (i.e. 100% volume) all the time. Then, in general, more efficient speakers are a more reasonable way to go.
Thorough, thought provoking and entertaining as always Matt! Glad to see you back to writing.
I’ve been listening a lot lately to the amp I built to the spalted alder design – a great sounding amp.
Looking forward to seeing your next project!
I am excited too – Thanks for the post!